Have it running in about 50 lines of R code (below). My problem is that my system is constantly popping and breaking heads, between construction and gardeners. And my Rachio meter has given up the ghost - never worked great. I don’t find the over / under very useful because it is always wrong.
Replaced hard-coded {user ID}, {client IDs}, {client secrets), {device ID}, and {auth tokens}. Toughest part was figuring out all the authorizations, and that the Flume {user ID} is the first numeric part of the {Client ID}.
library(tidyverse)
library(jsonlite)
library(curl)
library(httr)
# Set up data pull window
Start_text <- "2024-06-11 00:00:00"
End_text <- "2024-06-12 00:00:00"
#Auto conversions to POSIXct and epoch_milliseconds representations for the APIs
Start = as.POSIXct(Start_text)
End = as.POSIXct(End_text)
Start_epoch <- paste0(as.integer(Start) * 1000)
End_epoch <- paste0(as.integer(End) * 1000)
# Pull event history from Rachio
h <- new_handle(verbose = TRUE)
handle_setheaders(h,
"Content-Type" = "application/json",
"Authorization" = "Bearer {API key}")
request <- paste0("https://api.rach.io/1/public/device/{device ID}/event?startTime=", Start_epoch, "&endTime=", End_epoch)
con <- curl(request, handle = h)
# Format and filter Rachio history to just watering starts and last end
watering <- prettify(readLines(con)) %>%
fromJSON() %>%
mutate(eventDate = as.POSIXct(eventDate/1000)) %>%
mutate(Zone = str_extract(summary,"^.+(began|completed)"), Event = paste(Zone, subType)) %>%
filter(str_detect(subType, 'ZONE_STARTED') | str_detect(subType, 'ZONE_COMPLETED')) %>%
filter(str_detect(subType, 'ZONE_STARTED') | (str_detect(subType, 'ZONE_COMPLETED') & eventDate == max(eventDate))) %>%
select(eventDate, Zone, subType)
# Pull Minute Usage data from flume - limited to 1 day - 1440 data 1 minute data points
url <- "https://api.flumewater.com/users/{user ID}/devices/{device ID}/query"
payload <- "{\"queries\":[{\"units\":\"GALLONS\",\"request_id\":\"History\",\"bucket\":\"MIN\",\"since_datetime\":\"Start\",\"until_datetime\":\"End\"}]}" %>%
str_replace('Start', Start_text) %>% str_replace('End', End_text)
encode <- "json"
response <- VERB("POST", url, body = payload, add_headers('authorization' = 'Bearer {auth token}'), content_type("application/json"), accept("application/json"), encode = encode)
ldata <- content(response, "parsed")
# Convert list to dataframe
minWaterUsage<- do.call(rbind.data.frame, ldata$data[[1]]$History) %>%
rename(GalperMin = value) %>% mutate(datetime = as.POSIXct(datetime))
# Use Rachio Zone run data to annotate Flume minutes
intervals <- c(Start, watering$eventDate, End)
labels <- c("Off", watering$Zone[1:NROW(watering)-1], "Off")
minWaterUsage$Zone <- cut(minWaterUsage$datetime, intervals, labels = labels)
DaySummary <- minWaterUsage %>% group_by(Zone) %>% summarise(Gallons = sum(GalperMin), Minutes=n())
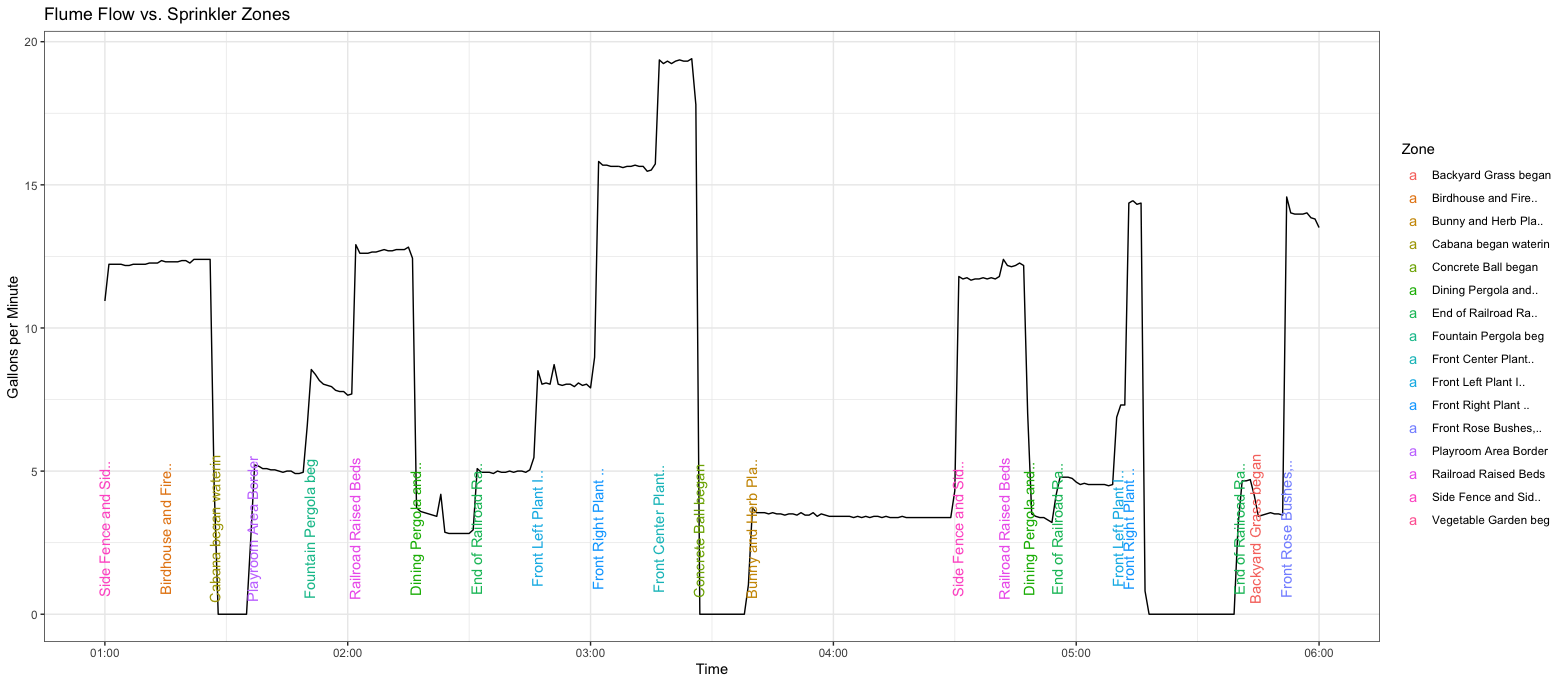
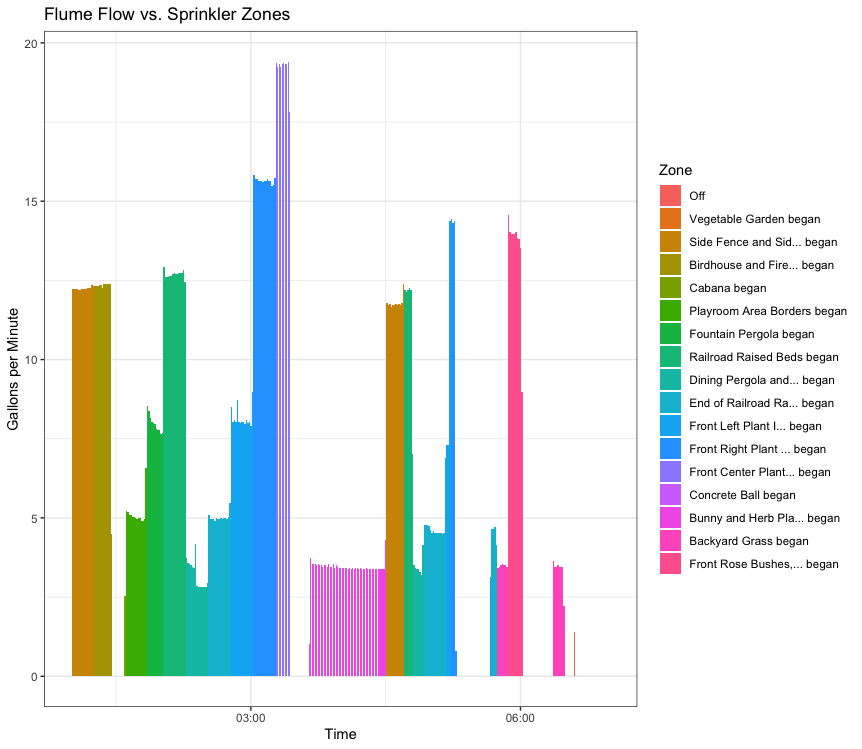
# Plot the overnight sprinkler run
minWaterUsage %>% ggplot(aes(x=datetime, y=GalperMin, fill=Zone)) + geom_col() + theme_bw() +
xlim(c(Start, End)) +
ggtitle("Flume Flow vs. Sprinkler Zones") + ylab("Gallons per Minute") + xlab("Time")