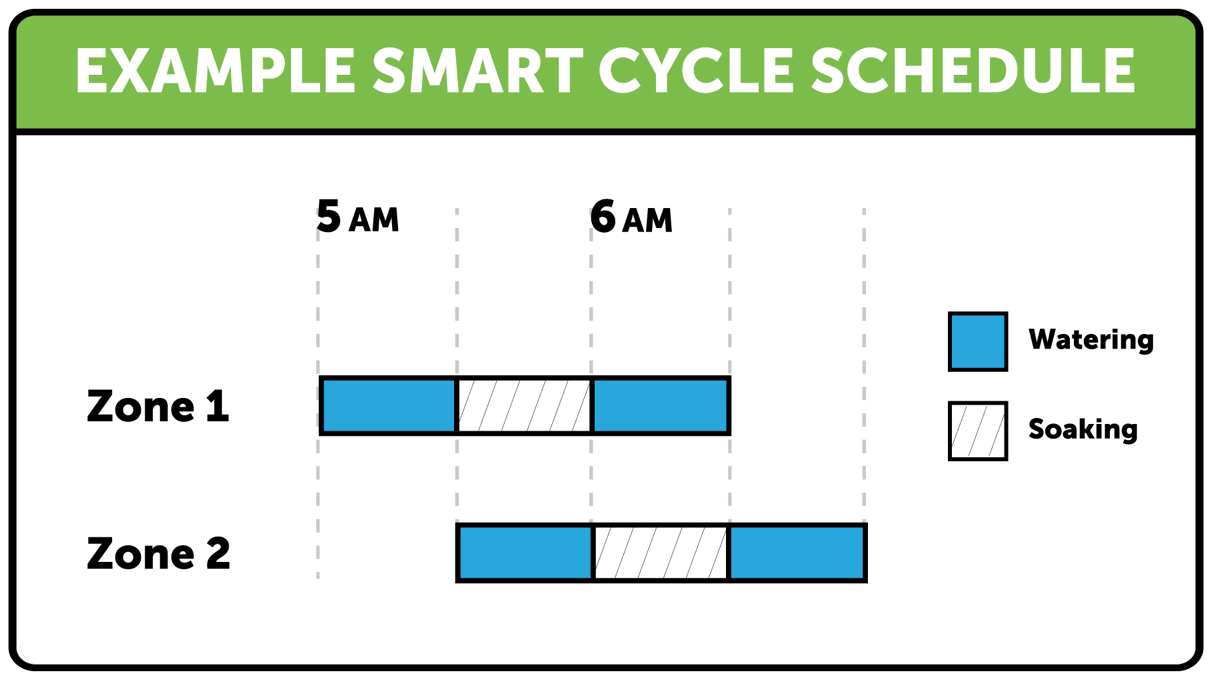
Is there a way I can see a timeline of the zone run schedule? Sort of the image like below? Would help to visualize the watering.
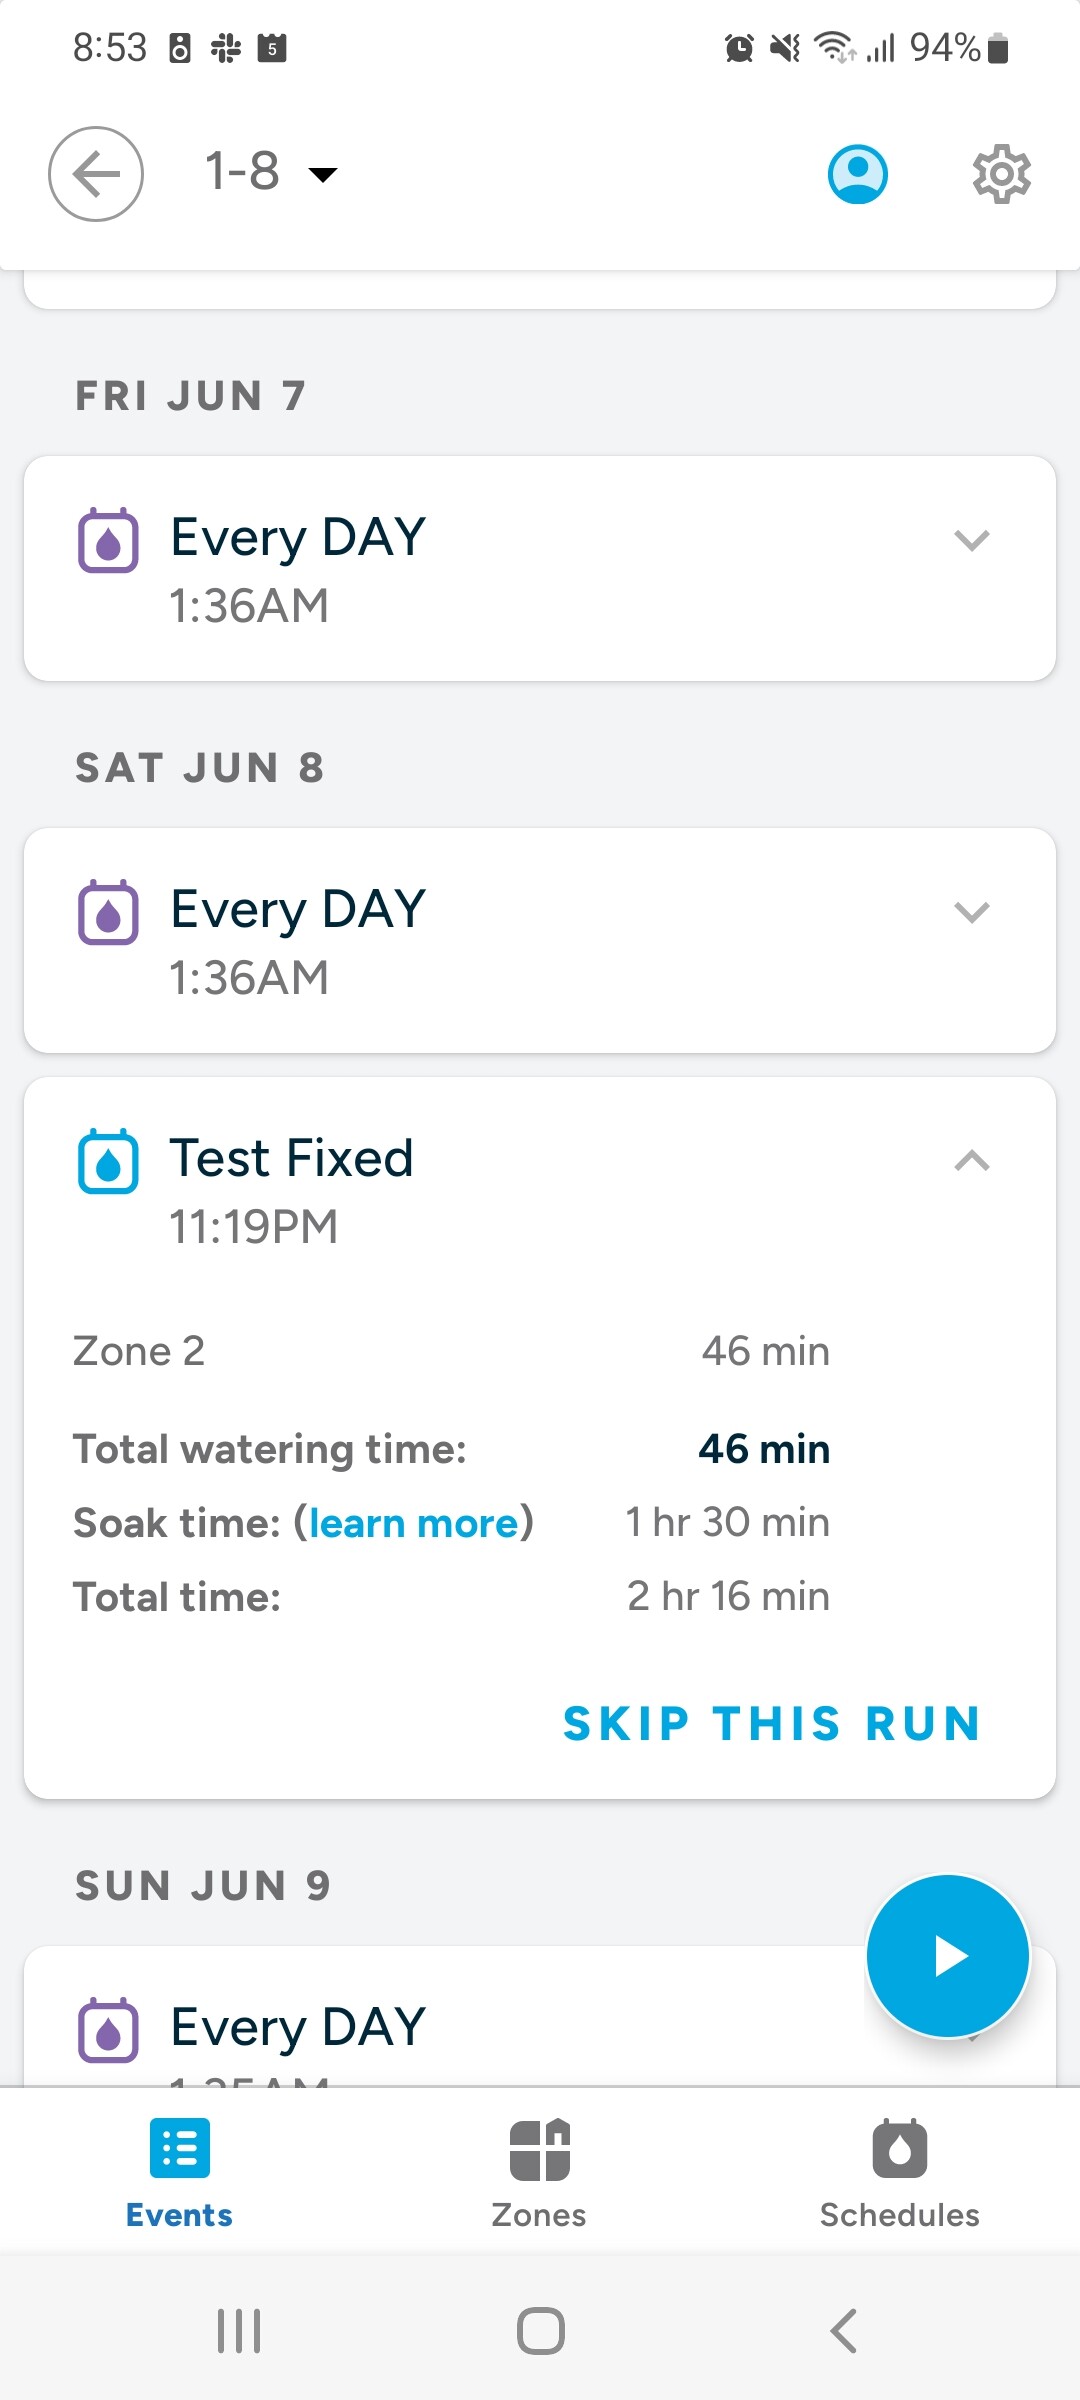
Something like this? If you tap on a schedule on the dashboard watering cards you can get a breakdown (not as sophisticated as the screenshot you had though)
![]()
Yes. but the above card wouldnt tell me how the soak cycle is introduced across zones visually. Would it be a huge task to get a graph like the screenshot going?
I will give that feedback to the product team.
![]()