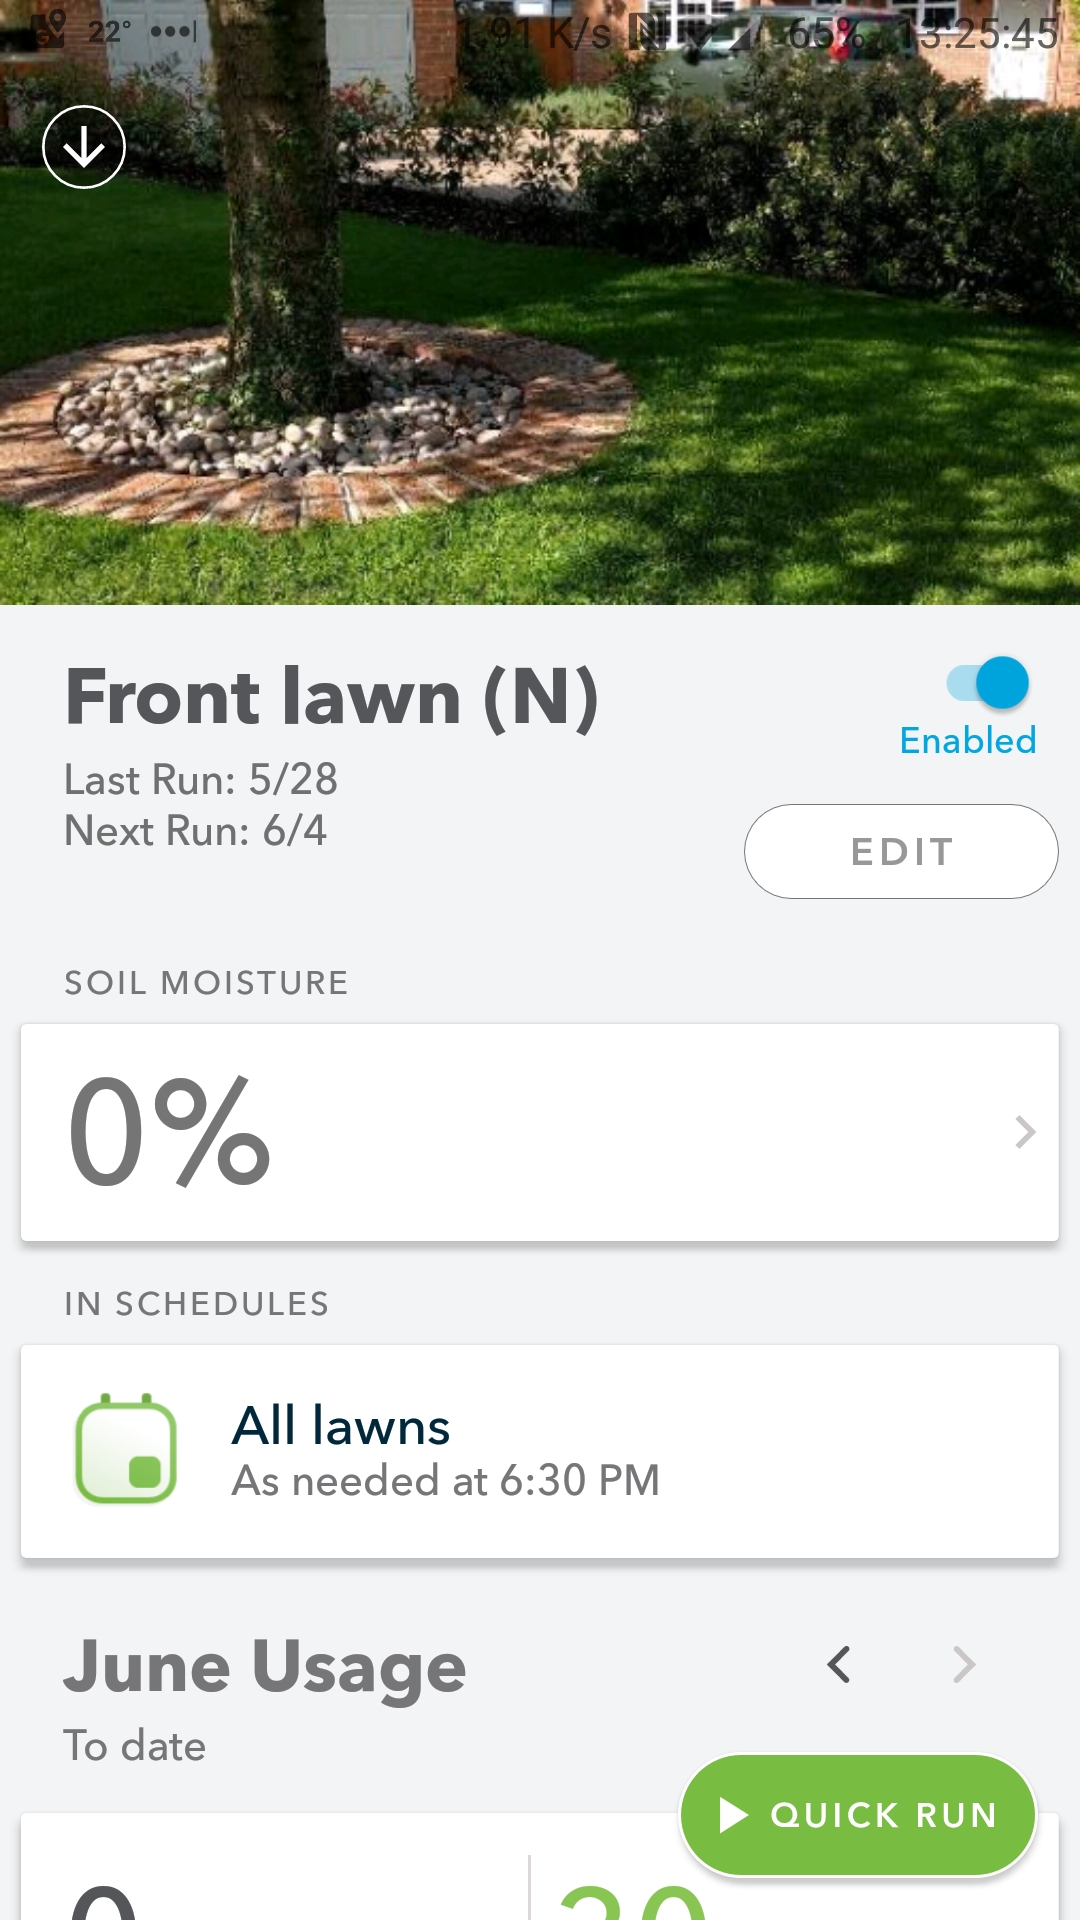
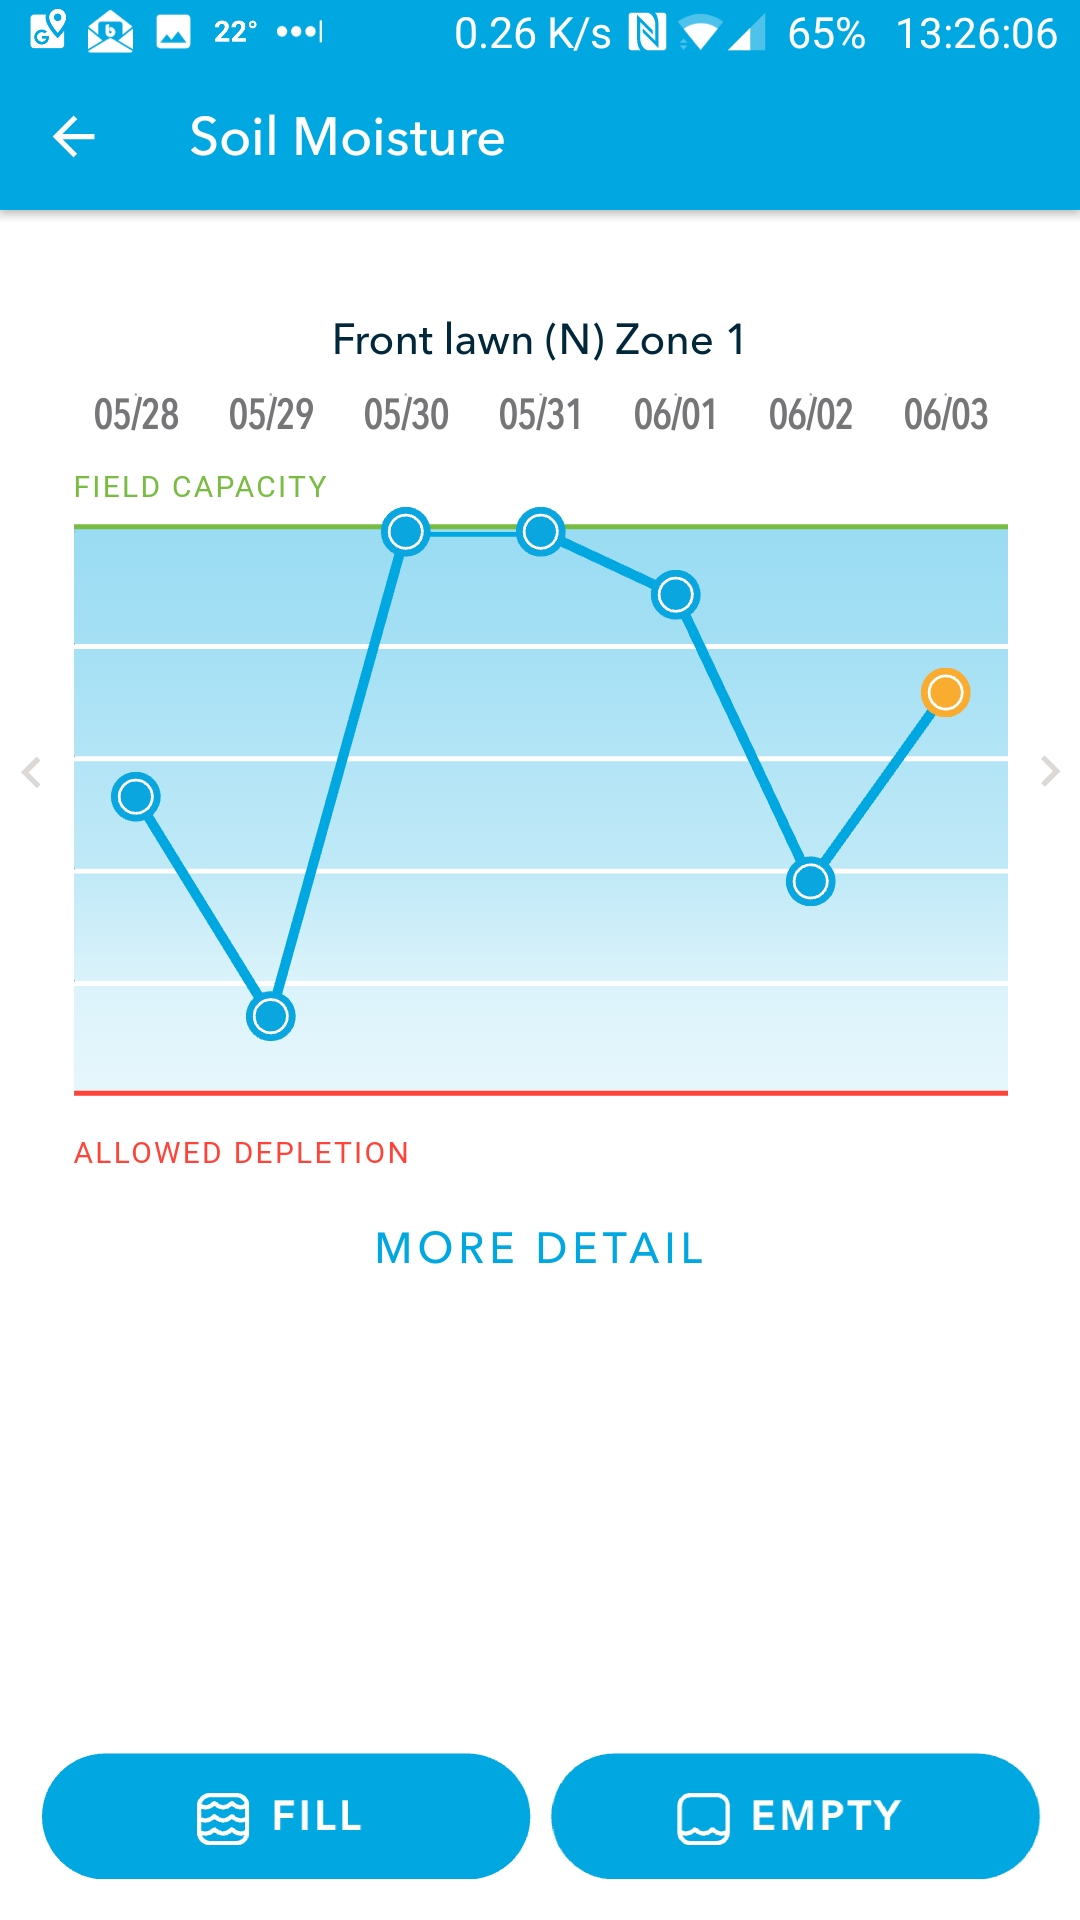
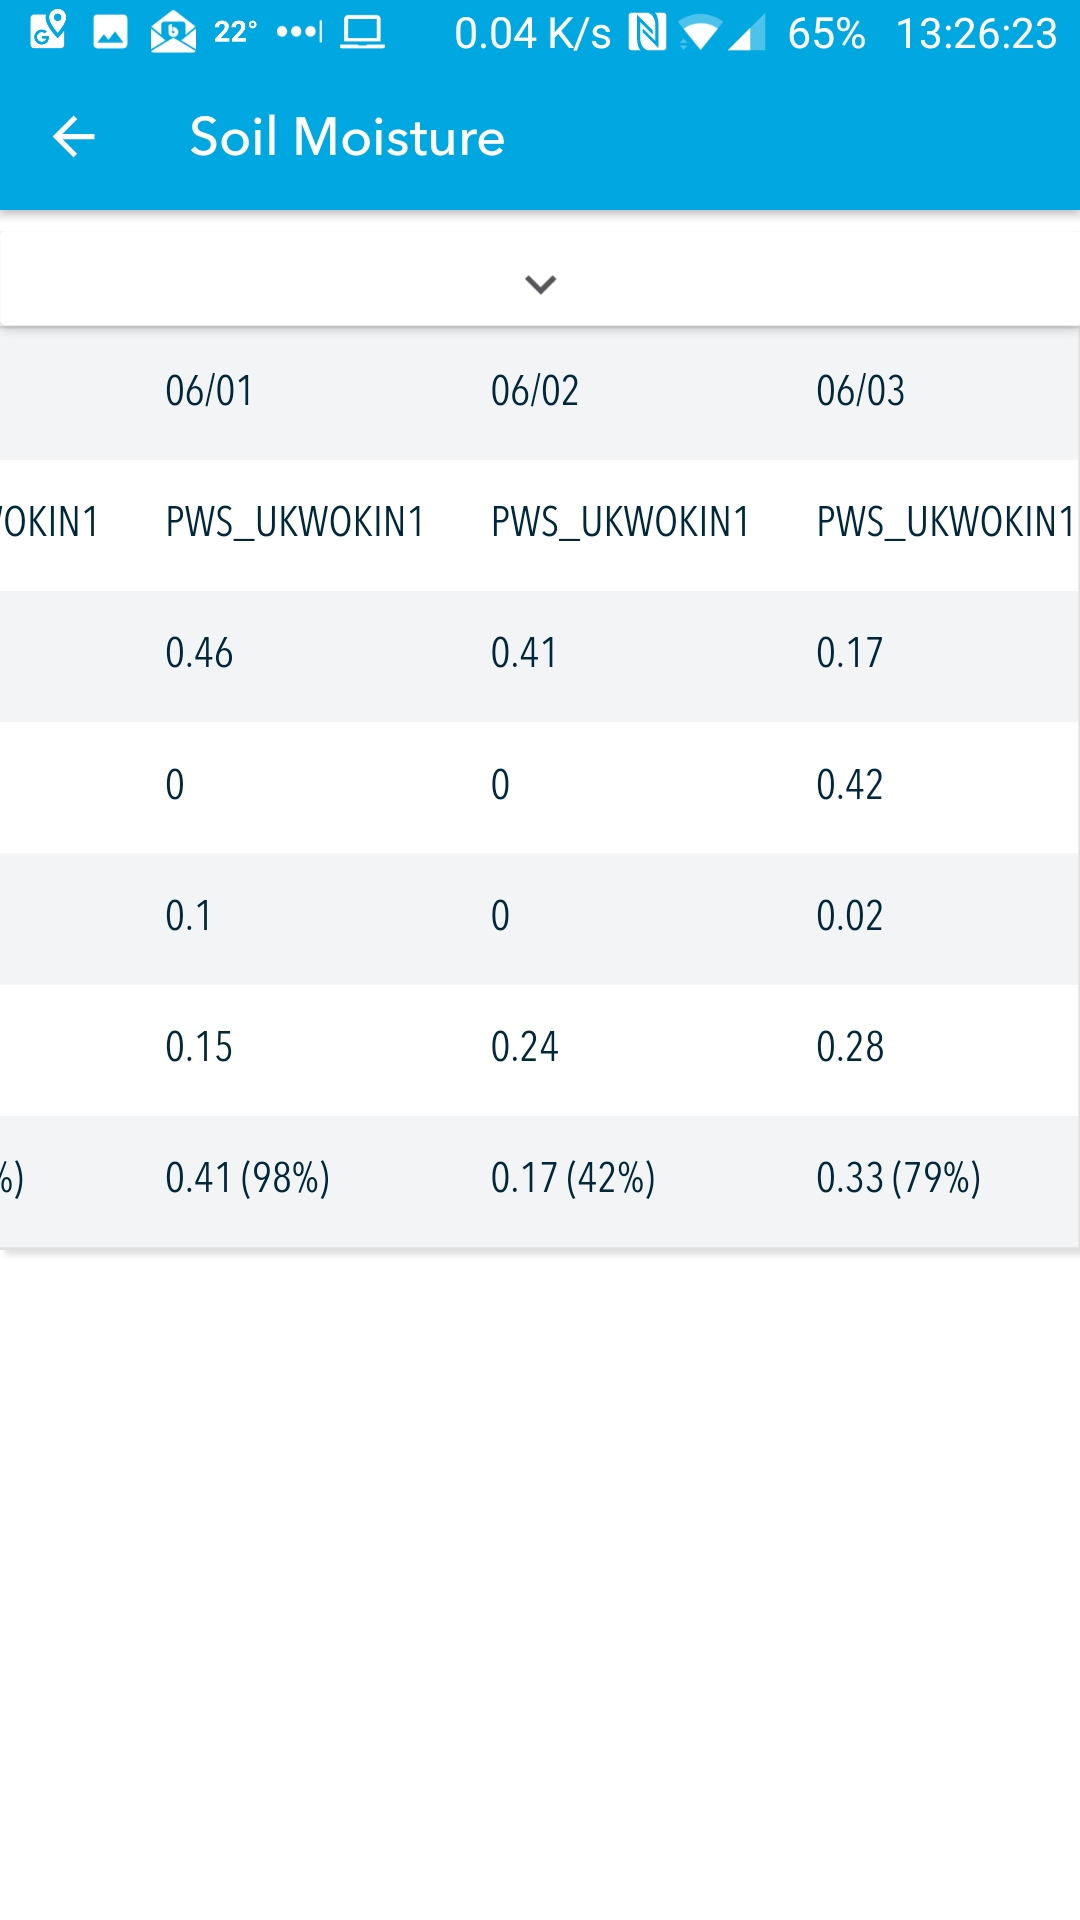
@WokingWounded I believe the zero percent is your current depletion level. What you see on the graph is a simulation of what your moisture level will be at the end of the day. It does look like that zone is watering today and will be at 79% by end of day.
Ah. I see what your saying but having a headline number on the summary screen which appears nowhere in the drill down makes no sense. I thought that if the numbers in the table were reordered it might help: start with the carried over figure, then today’s evotranspiration, then a subtotal (which gives the number on the summary page and chart), then the projected inputs (rain and watering) and then a final total. In the end I thought it would make more sense to have the same number in the summary, chart and table.