If you make changes, the schedule goes nuts for a while. I posted about it recently and no one at Rachio seemed to care. I guess you just wait it out until it stabilizes.
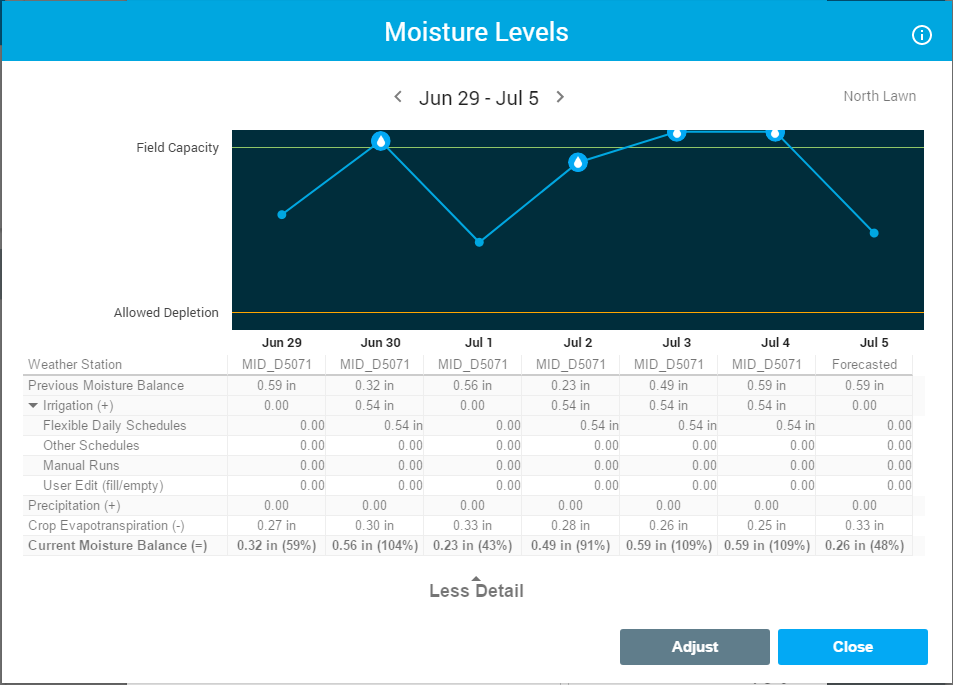
So I have been on my new schedule (not excluding weekends from watering) for a while now and I would have expected to see any abnormalities subside, but it is still doing some weird stuff…Here is the moisture graph for this week…again, it is coming nowhere near AD and triggering waterings even when already above field capacity… @franz, @mckynzee, anyone have any ideas??
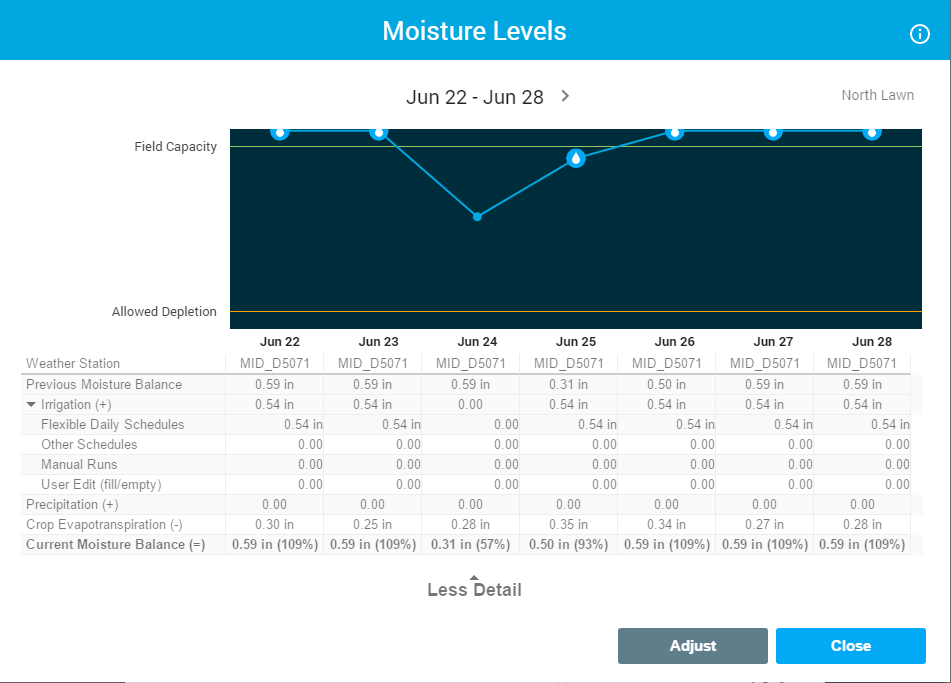
BTW, the week before was even worse  …6 out of 7 days watering, 5 waterings took place above field capacity.

Hey @tmcgahey-
I will have our development team review your account. Any chance you can click one week forward so I can check out your forcasted ET? Curious if maybe your forecasts are way off for one reason or another, causing your controller to decide to water and then making it look off when it’s corrected by observed weather.
@dblagent007 I am sorry to hear that your post was not resolved, I will find it and try to answer your question there!
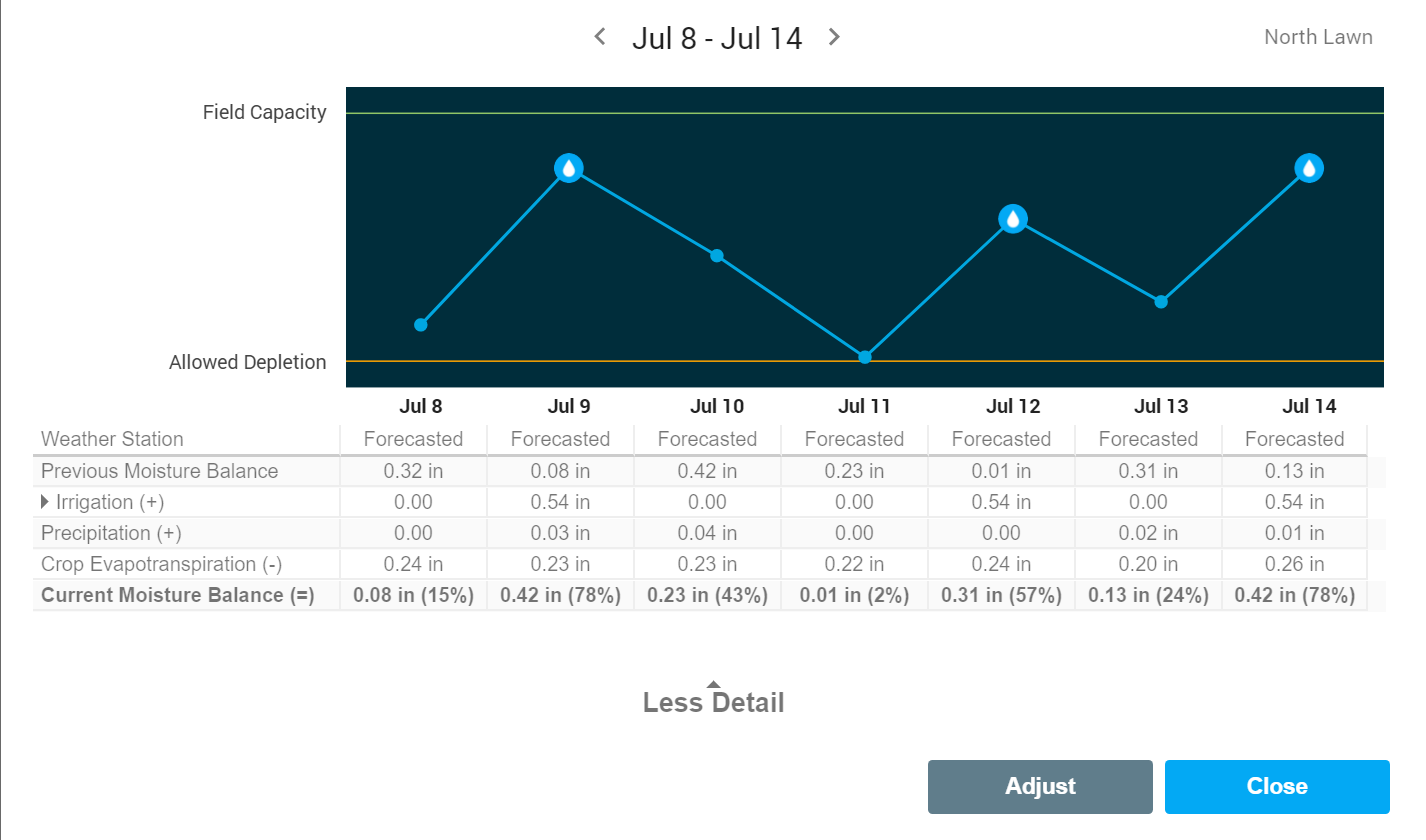
Here is next week. Just like before, it seems to settle out and be more what I would expect to see, bouncing between AD and FC.
I have watched my current weather station and haven’t noticed anything odd. Seems to be pretty accuracte
Looking forward for the next couple weeks, my schedule looks to be what I would expect, but I’ve still been hunting around for a reason as to why I was seeing multiple watering days when the moisture levels were well above AD, and in many cases, above FC…
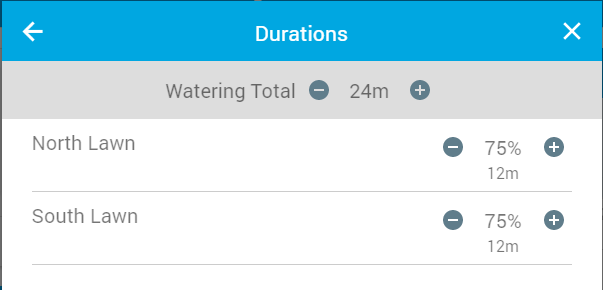
I stumbled across this under my “Lawn” schedule, although I don’t think this has anything to do with my random watering weeks. I have never been to this screen before, so I can’t say that I adjusted this, but why would it be set to 75%? My drip zones are set to 100%.