Hi - I had to analyze my watering schedule recently and went to review the history. It would be a lot more useful to see how its all working to download the event list in csv format, rather than view the html event list. I was able to copy and then reformat it but what A PAIN.
Here’s my suggested fields:
Event Status time Description duration units/note
Schedule Completed 5/4/18 2:21 Water all zones ran for 382 minutes.
7-shrubs and trees Completed 5/4/18 2:21 7-shrubs and trees completed watering at 02:21 AM (PDT) for 4 minutes.
7-shrubs and trees Soaked 5/4/18 2:18 Soaked 7-shrubs and trees for 30 minutes, completed at 02:17 AM (PDT).
with dates and duration as values that excel can recognize.
It was then easy to see where/when it was watering, soaking etc.
I have been wanting a csv download of the history ever since I got my Rachio in 2015. For those of us who like to track things and analyze what we have set up, it would make things much, much, much easier. I’d even settle for a simple csv dump with one line per event as a start. At least I could go in and parse that myself.
@neilr, how were you able to copy the history? With the previous web app, I could copy and paste the history and then work with it. But using Chrome on Windows 10, with the current web app, I can’t even copy and paste it any more.
I’ve set up IFTTT to capture events, but it only partially captures things, and I can’t use it either. I either get a total amount of watering time (duration)for an entire schedule (I want to capture it by zone), or I can get a start time and end time (not duration) by zone, only it doesn’t tell what zone is starting and stopping. And I’ll get multiple starts with only one completion. Or two back to back completions with no starts. Or it just totally misses events (For example, I have a flower zone in it’s own schedule. IFTTT logged that it started this morning. But it never logged that it completed. Yet an hour later, it recorded one of my drip zones starting.) So IFTTT is pretty darn useless too.
CSV would be terrific if granular enough to differentiate zones and individual run times (as you explained above). Historical soil moisture/weather CSV would be an added bonus. Excel, Numbers and my daily workhorse, Workflow for iOS, have terrific support for CSV. Most scripting languages (like Python) have great CSV modules for parsing. Would be great to select the date range, limited of course, to however long Rachio keeps history (one month?). To me this isn’t a critical missing feature… it’d just satisfy the unreasonable desires of a data nerd :-p
Neil, is there still an available link anywhere to download usage history? I don’t want to get into API work if I don’t have to, but a simple CSV with device, zone, date/time, and run-time would work. Love the device and the control, but ‘support’ for this kind of thing seems pretty poor. Thanks for any help.
Hello franz. A historical download BY ZONE is what I am after. It is very difficult, if even possible, to understand what is happening with flex daily without that. Is it at all possible to get such a download?
Thank you, I’ve seen this, but it is not what I’m looking for, and based on all the discussion in the community on the topic, not what many others are looking for either.
I would like a historical download that includes for each run for zone - including zone, date, start and stop time, and maybe gallons and maybe flow rate, though I can get that from start and stop time and flow rate. I would rather not have to go to each of 13 zones and have to manually enter it into a spread sheet over and over again. Data aggregated across zones, month, or day is not helpful. I want to know how the system is running, not just how much water it is using. I am trying to use flex daily, and if it is not working well I want to know how often it is running and how long.
The data is there, seems it should be easy enough to pull for a download.
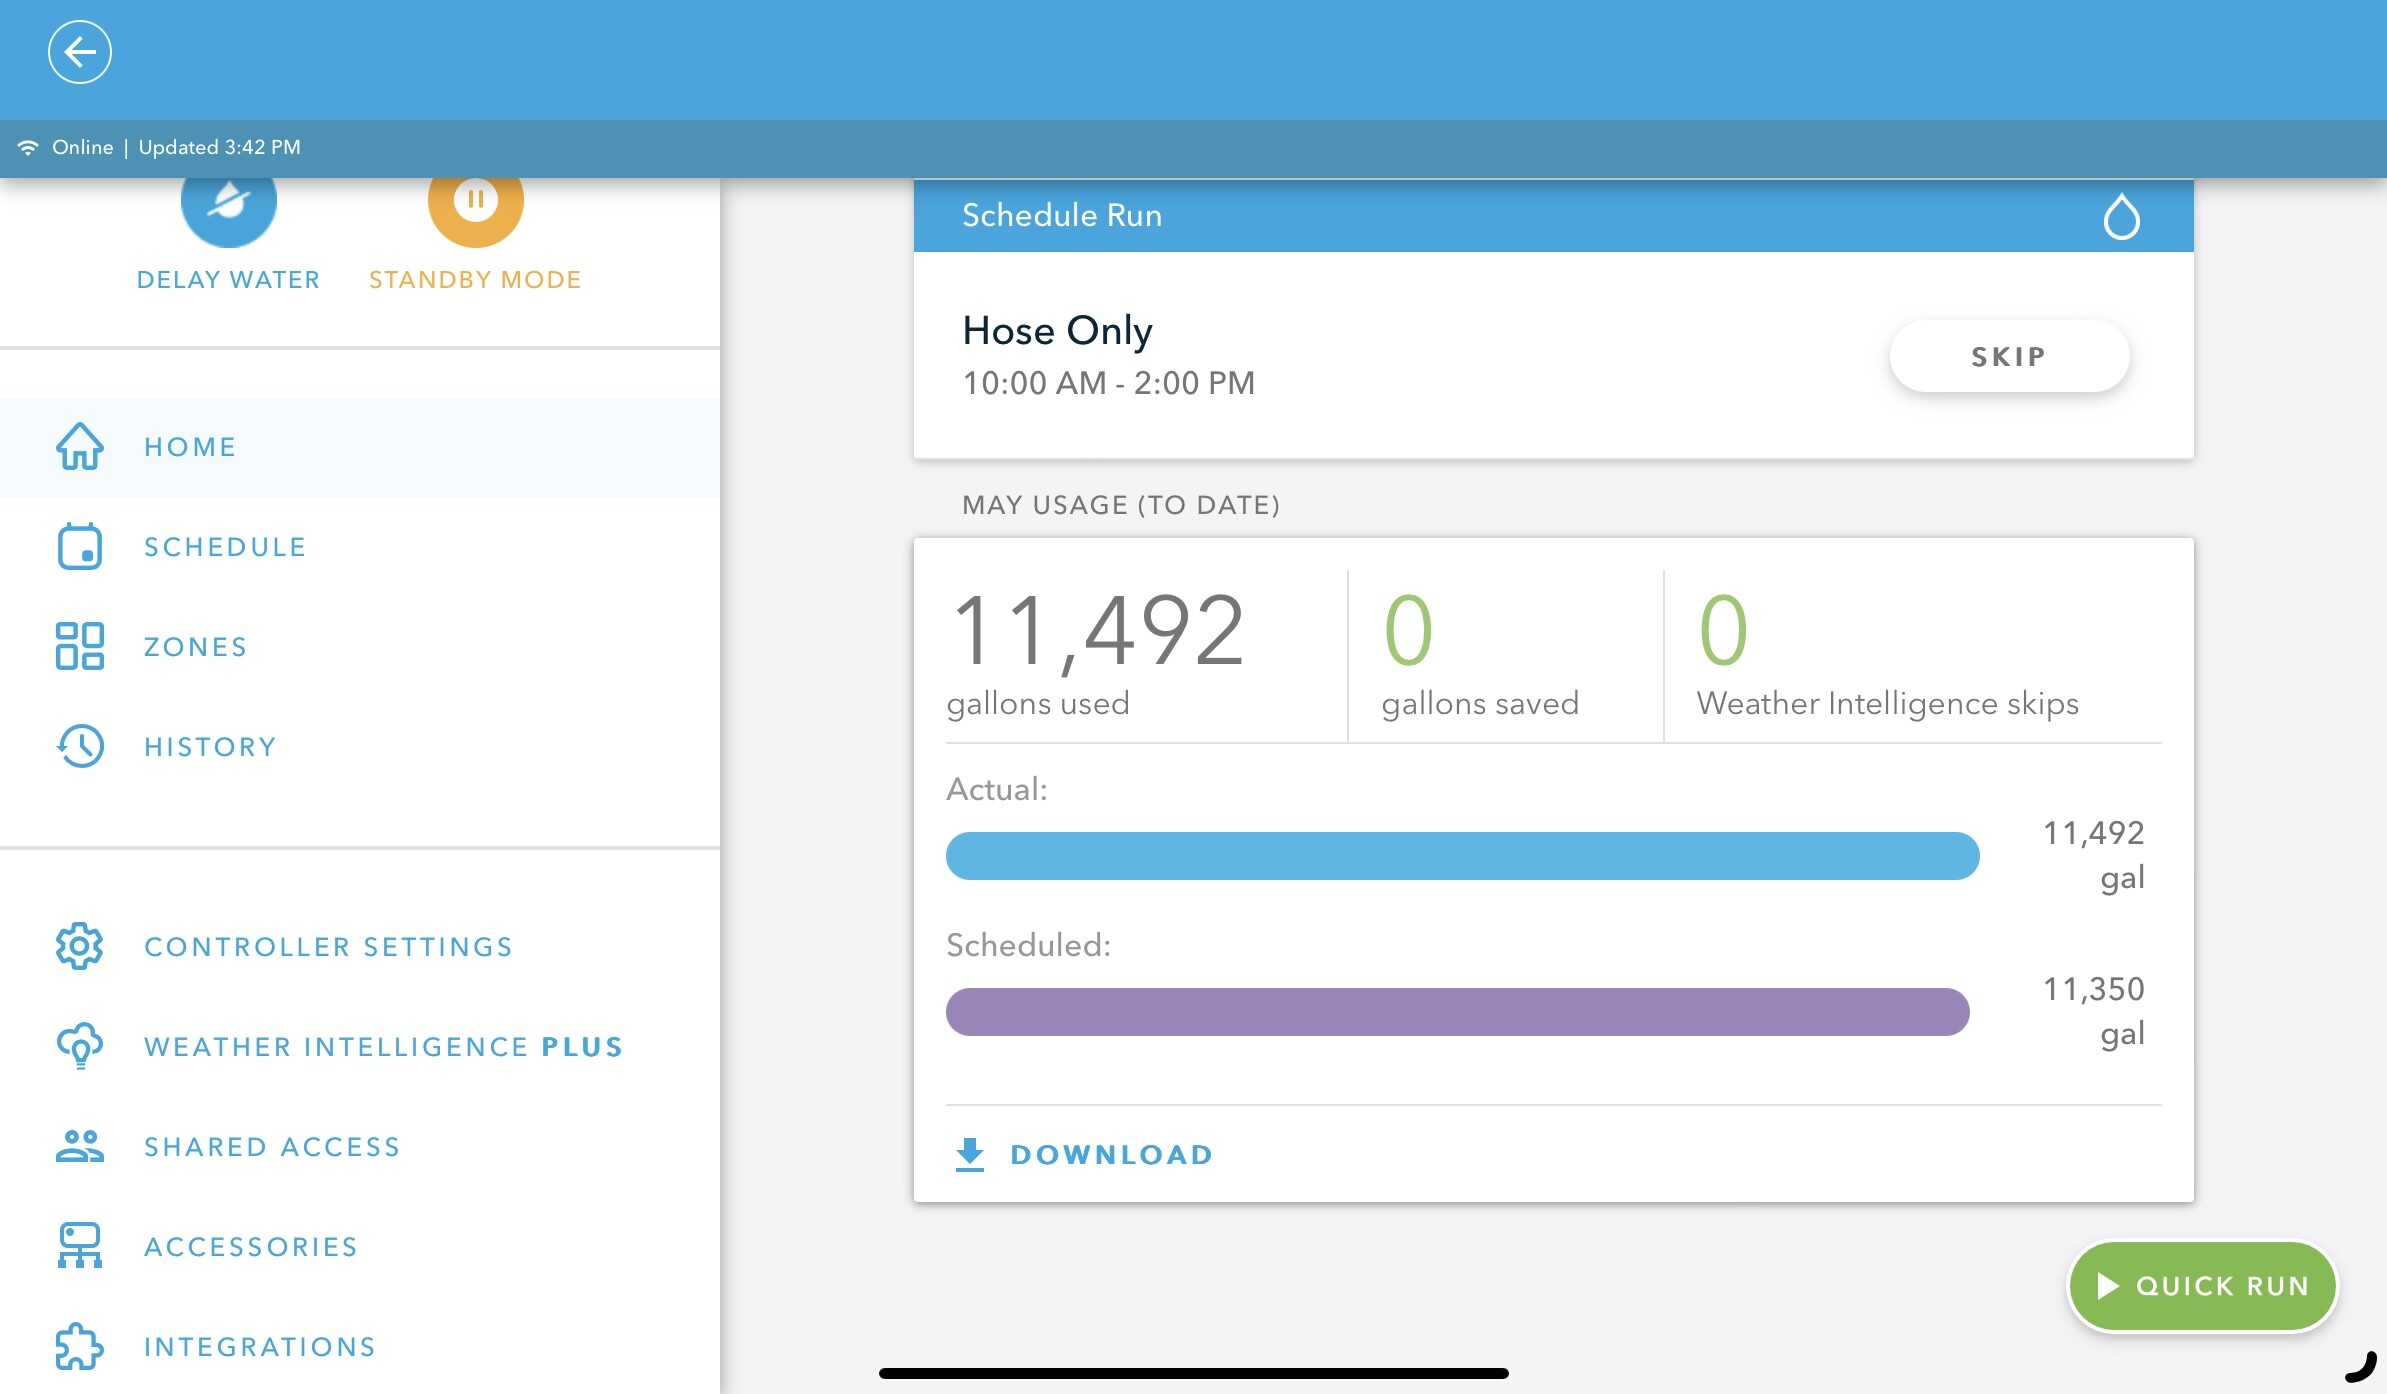
Login to the web app https://app.rach.io/
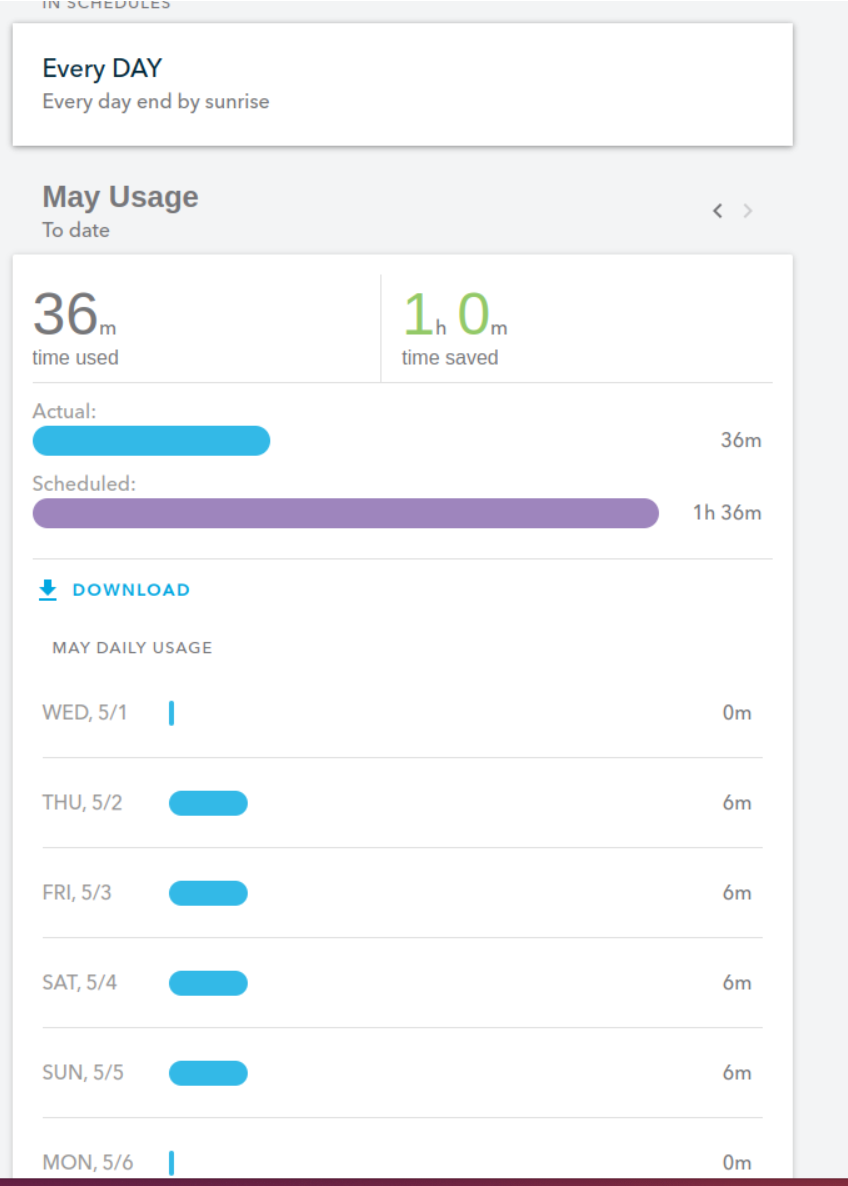
Click on your controller, the home on the left. Scroll down on the right to usage and there is a link to download a csv file to total usage. Not broken down by zone unfortunately
And come to think of it, I also need future schedule by zone. My system just ran one zone for an hour and a half on the 14th, and it says it is scheduled for another hour and a half, on the 16th. That’s crazy talk for desert adapted plants. I pt is difficult and time consuming and I shouldn’t have to figure this out manually to see how flex daily is workin* and whether it needs adjustments. Too much water is wasteful, especially in Las Vegas, and costly.
Please please figure this out to make data more easily accessible!