I created a phantom 100% crop efficiency zone to avoid math and checked against NWS/NOAA Field Reference ET (FRET) gridded product. I also regularly checked California’s CIMIS calculated ET for the nearest station as another datapoint. It took many days to complete validation (allowing for differences up to several hundredths an inch and subjectively accounting for local conditions).
1 Like
Right, this is my concern. ET is the most important variable in the MAD calc that determines when a zone will water. We select a PWS for more accurate readings, but the ET calc is getting it’s inputs from somewhere else? How do we know what data it is using?
At the very least, it would be good to state that on the moisture charts page. As is, it looks like ET is being derived from the PWS selected. If you’re not going to use PWS data for ET, then that data that is used should be exposed in some way (CSV download?) so we can do our own comparison.
Not that I don’t trust you guys or anything ![]() I just spend a lot of time setting up a PWS thinking it was giving me more accurate inputs into ET, which is kinda important here in FL.
I just spend a lot of time setting up a PWS thinking it was giving me more accurate inputs into ET, which is kinda important here in FL.
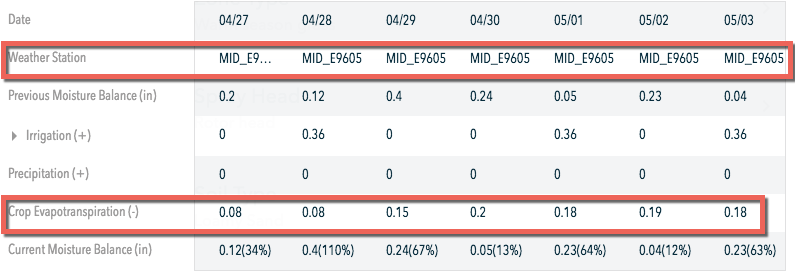
Some more confusion as I dig into the data… what in the world would cause ET to more than double from 0.08 on 4/28 to 0.2 on 4/30 (shown in the screenshot above)??
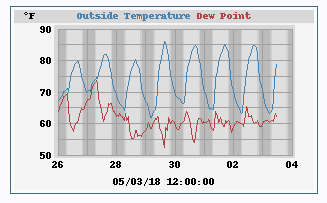
My local PWS reported only a 5 degree change in temp from 80 -> 85 during that time:
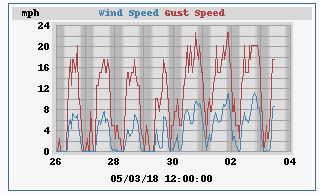
Wind was modestly up from ~6mph to ~10mph:
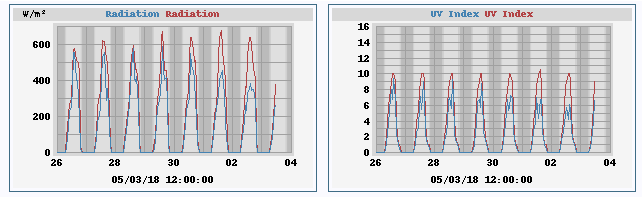
No big swings in UV/radiation:
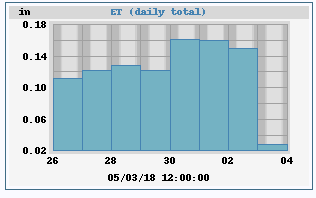
And while I understand that Crop Coefficient is not reflected, ET did not double when calculated by my PWS, only a marginal gain in ET (0.13 -> 0.16):
Doing some more research now to see if my PWS uses Penman-Monteith for ET.
edit: confirmed with the weewx developer that the software calculates ET using Penman-Monteith