Any idea why the data for the last couple of months is missing?
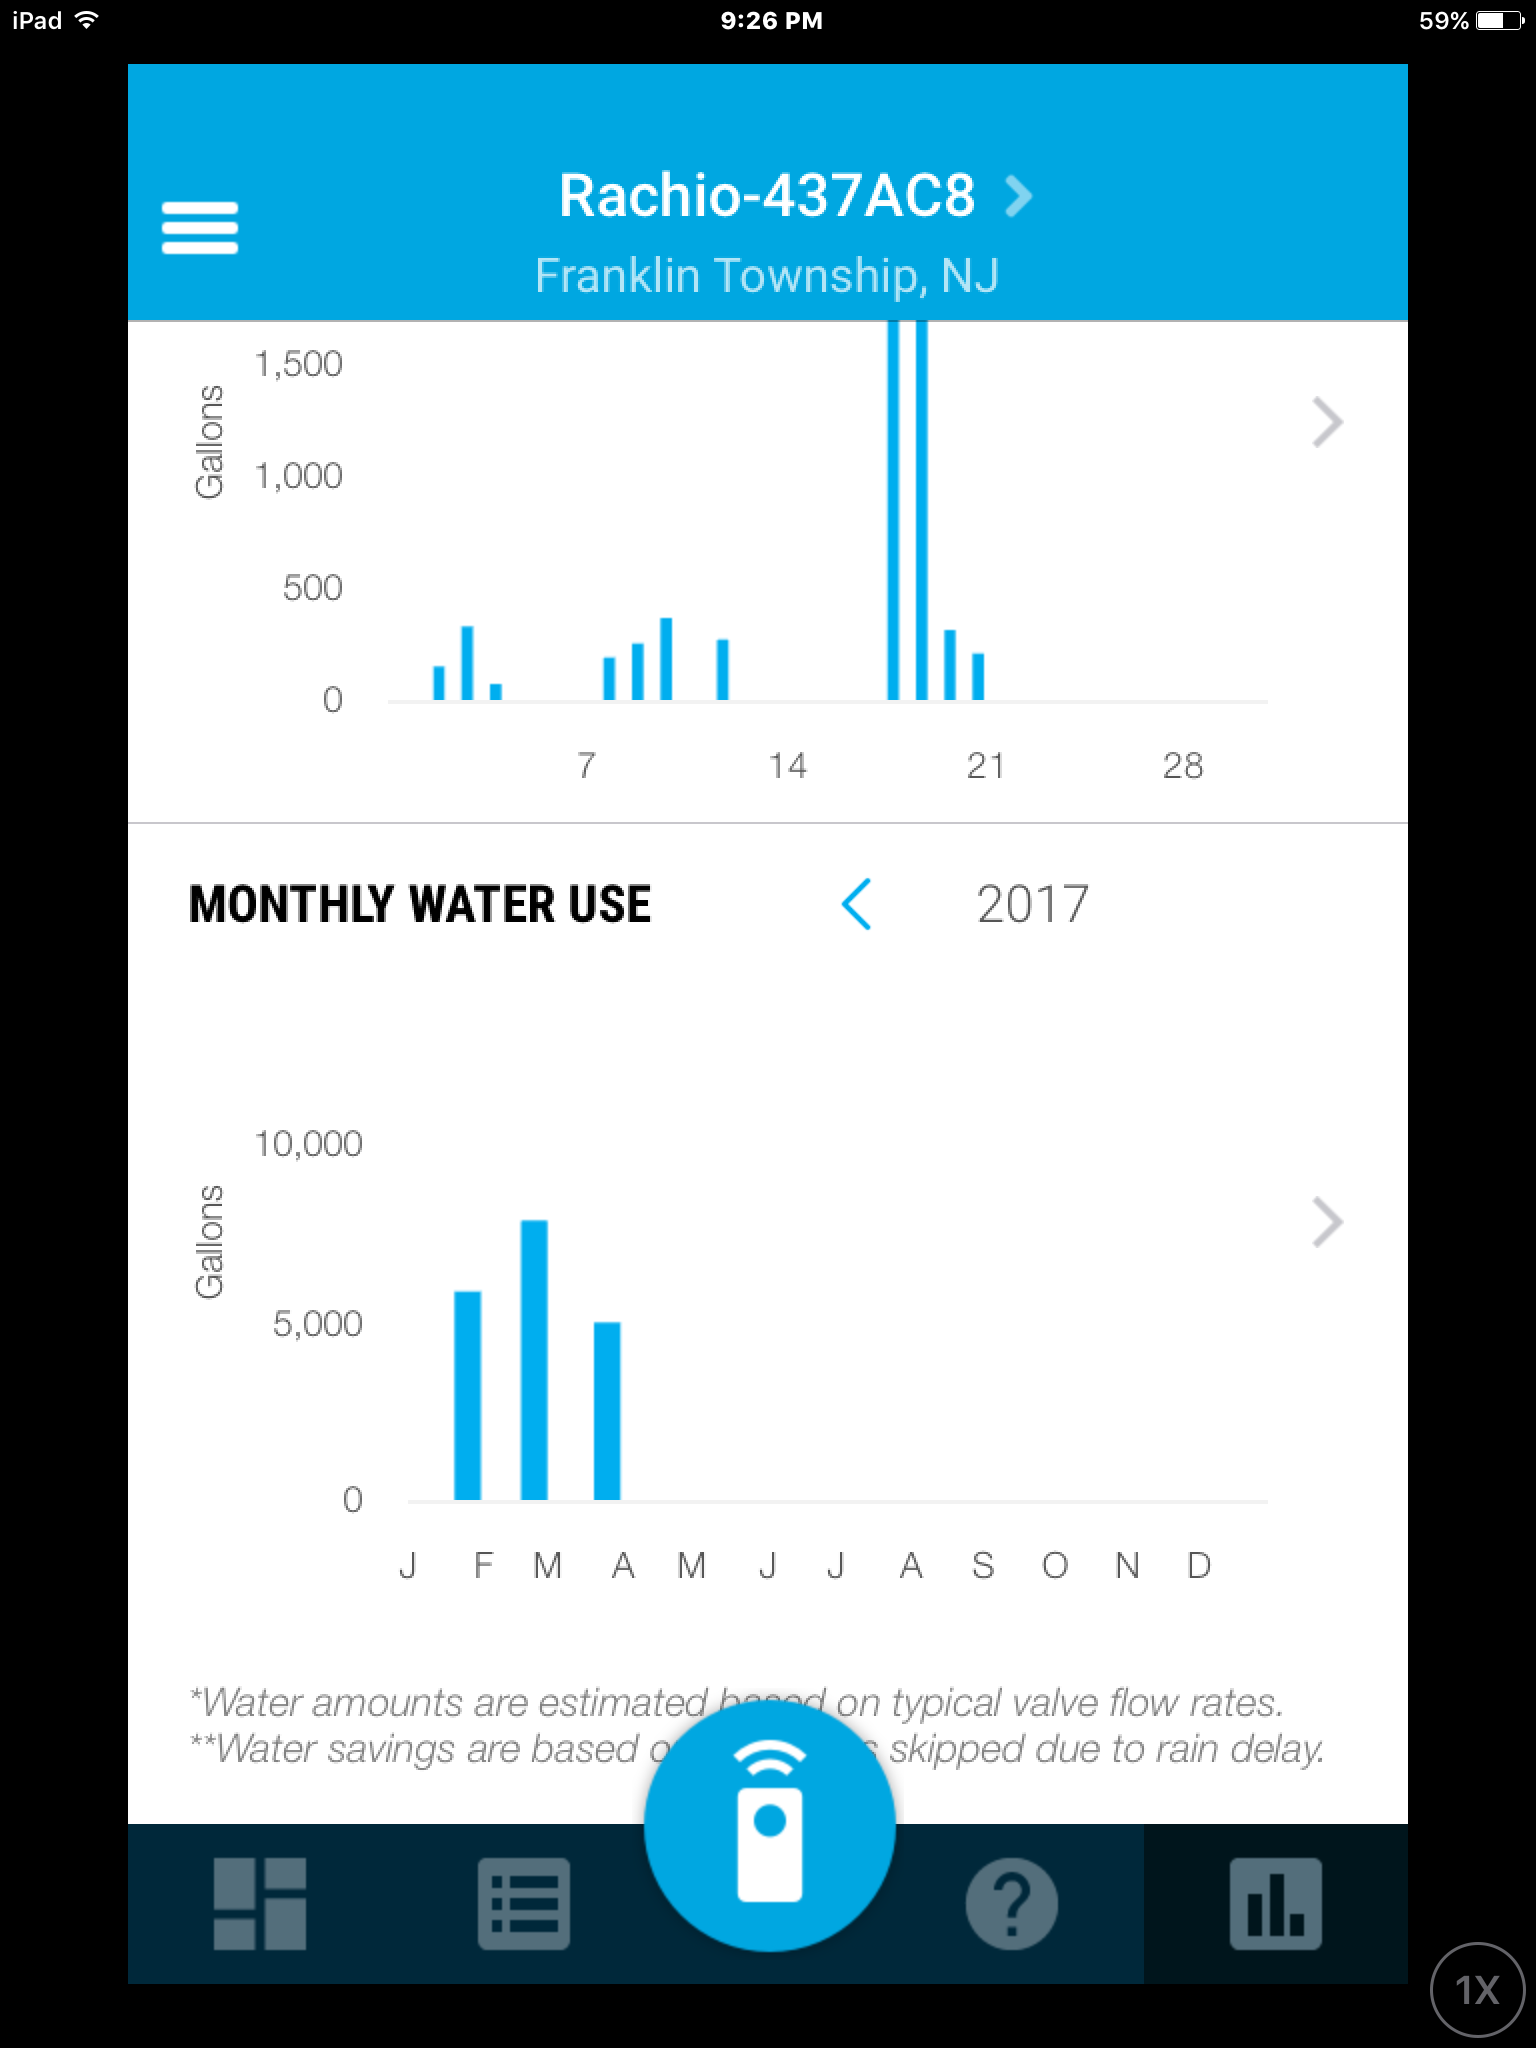
Stays the same even after refreshing the screen.
Any idea why the data for the last couple of months is missing?
Stays the same even after refreshing the screen.
Two additional questions:
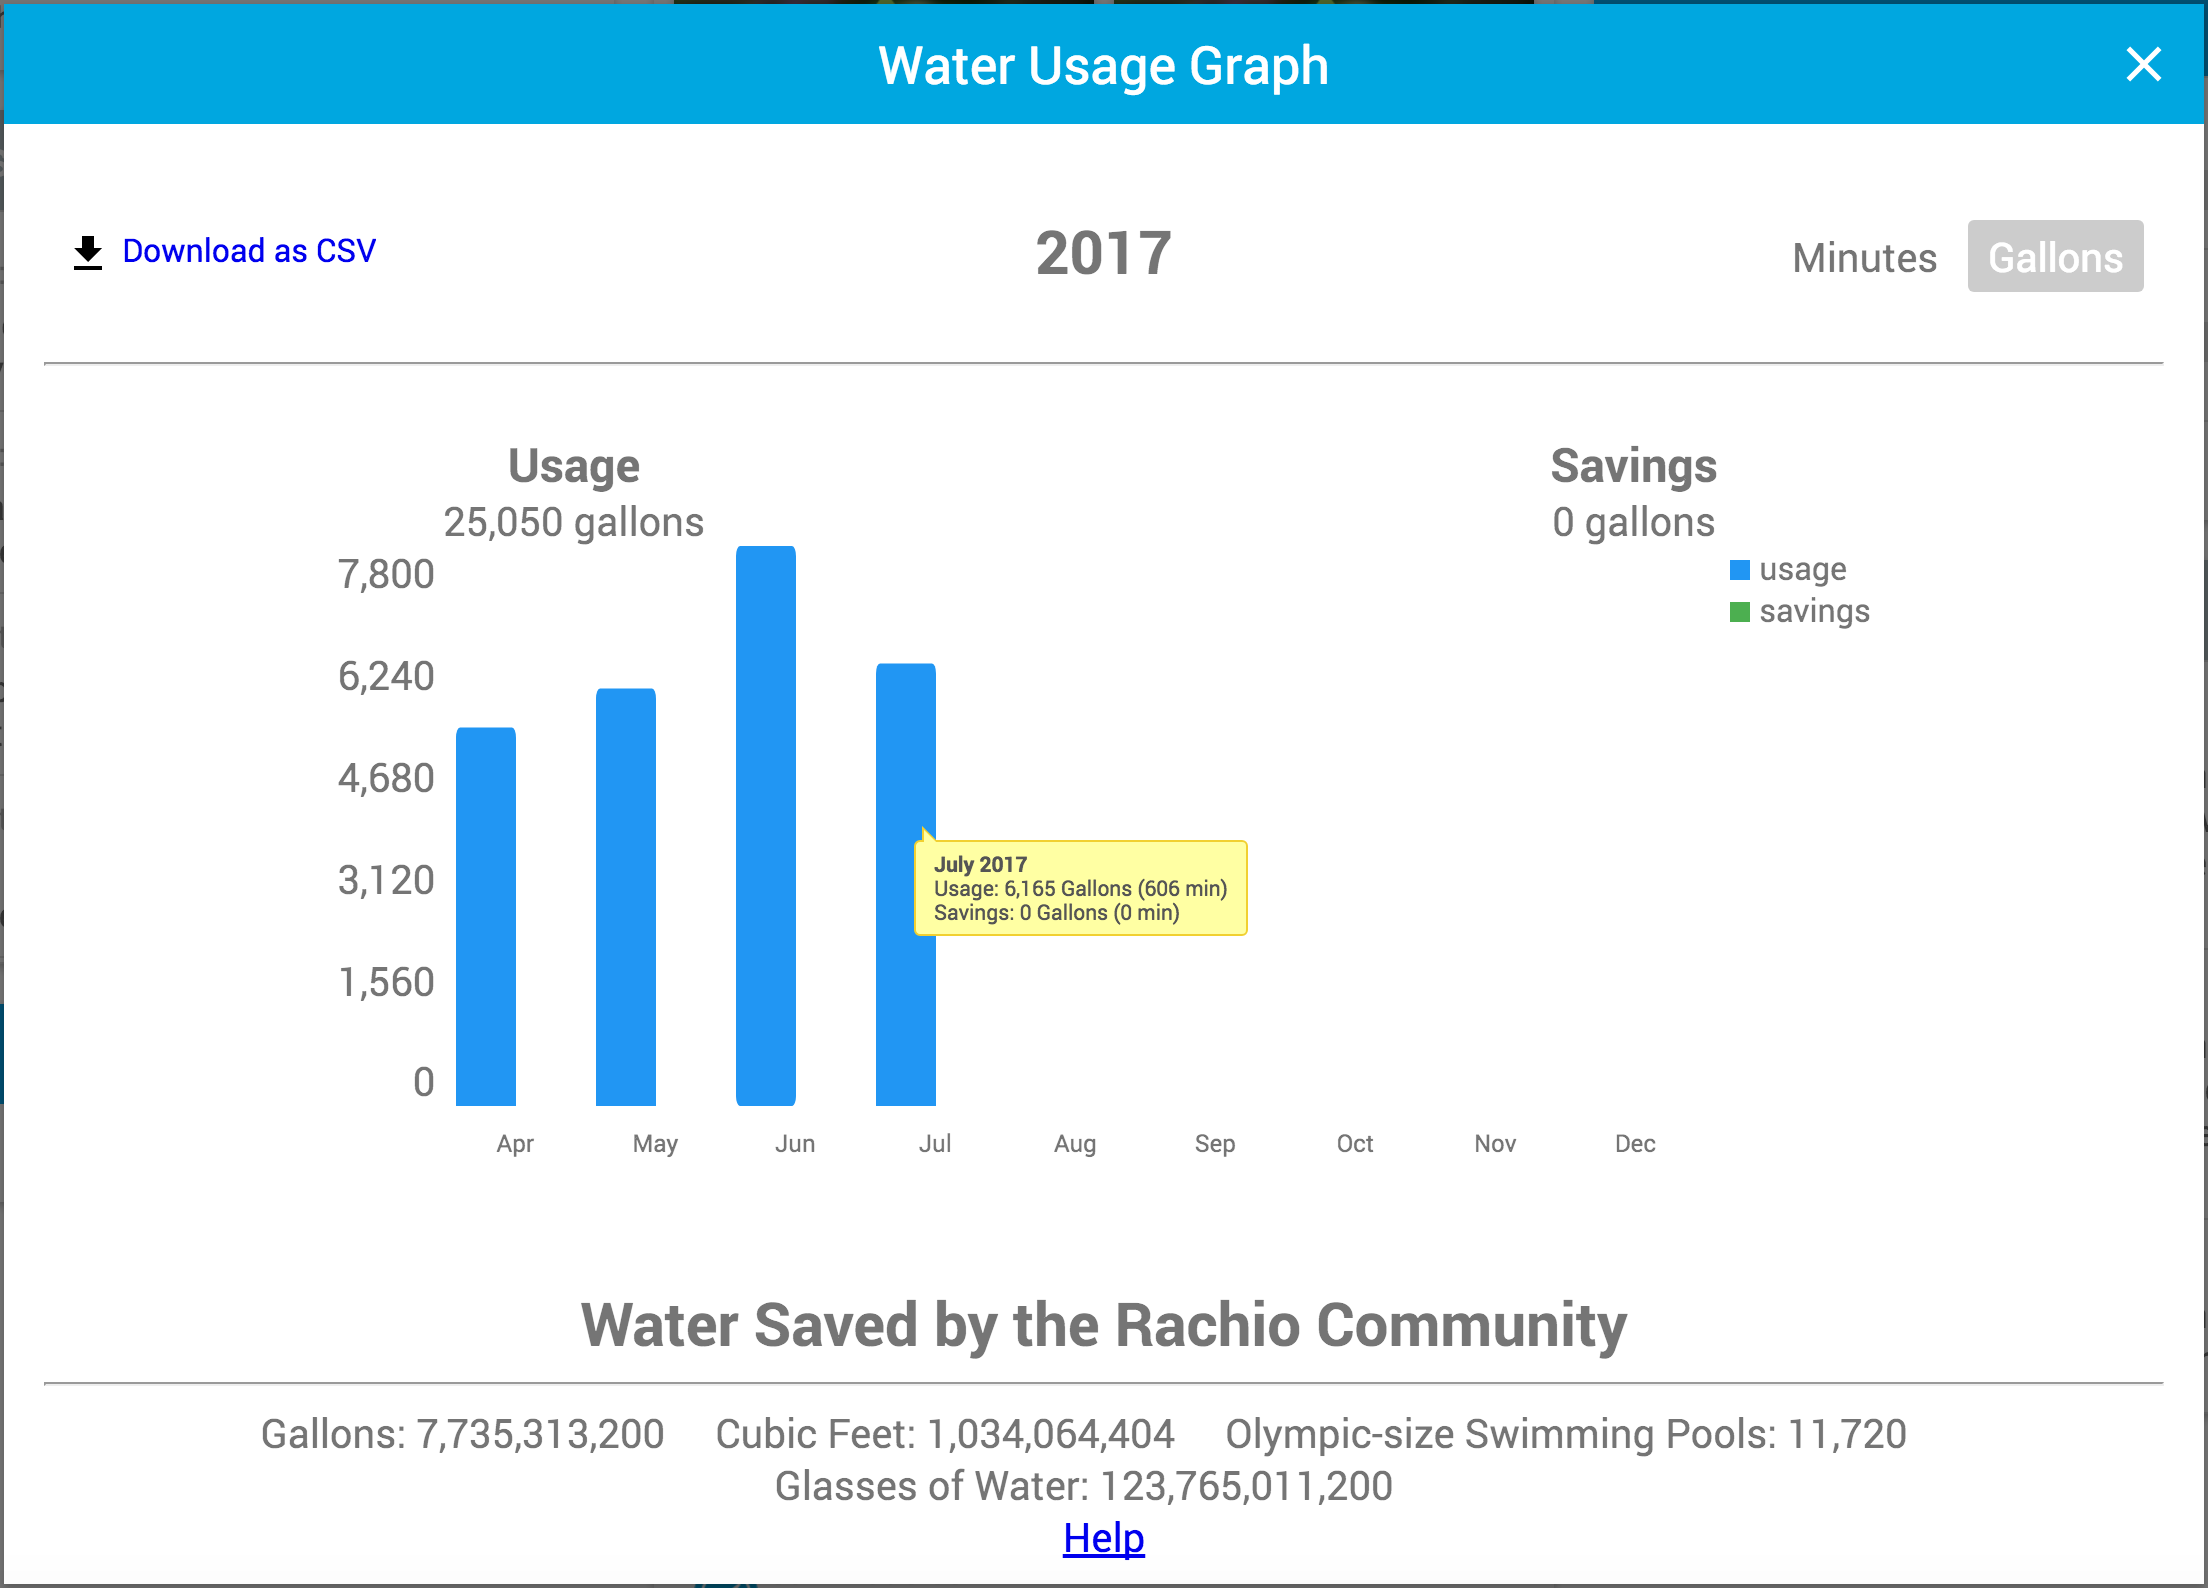
Is it possible to see the actual numerical values for gallons used per month(sort of how you can float values over each bar in a bar chart in Excel)? The graph’s bars show values that are not visibly discrete.
The text beneath the graph is greyed out. It is far too light to be legible. i.e., I cant read it.
Hey @garyjnj1,
Thanks for bringing this to our attention. The monthly water usage being reported on the incorrect months is a current known issue exclusive to the iOS platform. Our developers are aware, and currently working on a fix. While I unfortunately don’t have any information regarding a fix date at this time, I’d encourage you to rely on the WebApp in the meantime to review your monthly water usage as this graph is accurate
Using the WebApp you will also be able to view the exact numerical usage that you’re looking for:
And you can even save your results as a .CSV file for your own tracking if you’d like.
Our developers are hard at work on developing improvements to each of our platforms to provide more parity. When we have more information to announce, rest assured we’ll be letting all of our users know!
Thanks for your patience. Hope this helps!