I have been experimenting with using Flexible Daily Schedules, and I’m not getting the results I was expecting relative to temperature changes.
First off a question: Is there any way to download historical watering/moisture/weather data into something that can be loaded into a spreadsheet? That would sure make analysis easier than trying to do stuff via screen shots.
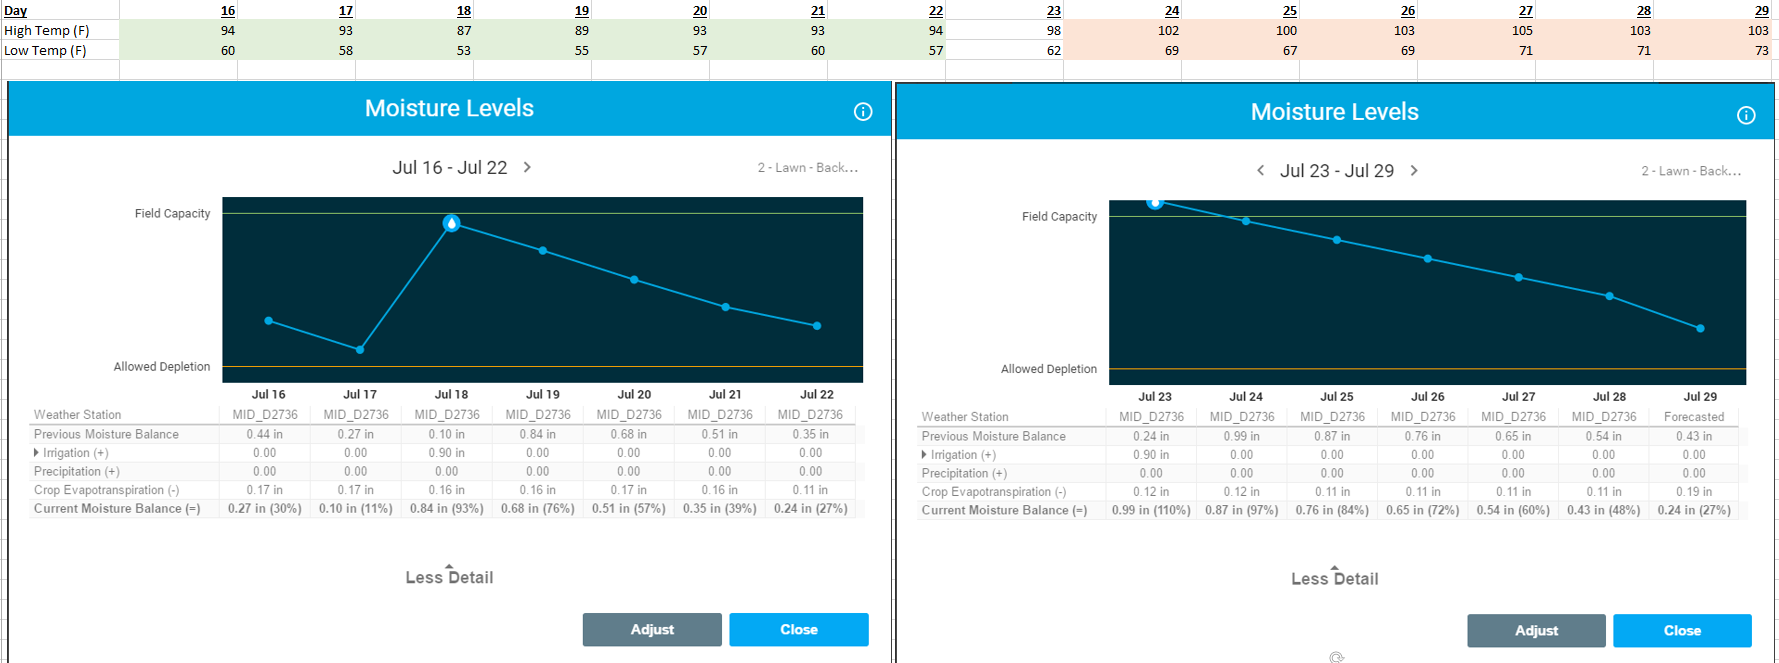
Now for the data I don’t understand from my Moisture Levels screen:
Crop Evapotranspiration from July 16-21 (“1st week”) was in the 0.16-0.17 range. During this time our temperatures were below normal running in the upper 80s to low 90s.
For July 22-28 (“2nd week”), Crop Evapotranspiration takes a dramatic drop and runs in the 0.11-0.12 range. However, the temperature were dramatically up for a heat wave during this time, running 100+ for all but 2 of these days. Shouldn’t this cause evapotranspiration to go up?
For July 29, the forecasted Evapotranspiration value is 0.19. This seems more in line with the data from the 1st week. Given that July 28 and July 29 had essentially the same weather (103 degrees and sunny), why is the actual value 0.11 on the 28th with a forecasted value of 0.19 on the 29th?
So basically I have two questions:
What caused the dramatic evapotranspiration change between July 21 and 22?
Why aren’t the evapotranspiration numbers higher during the 2nd week heatwave with temperatures 10-15 degrees warmer than the 1st week?
I’ll upload a screen shot if I can figure out how, but in case I can’t here are links to a
Forecasting is using the best weather data available at the time (radar, satellite, historical) to derive max temp, min temp, humidity, dew, and wind. This ultimately is a forecast and is the best we can do at time of forecasting the ET value.
So this is interesting, the weather station you have chosen (MID_D2736) was reporting solar radiation data up until July 21st and then stopped. This is why you are seeing a large change from the data reported from the same station. We interpolate solar radiation when not received from a station (which is most of the time) and our interpolated value must be different than what the station was reporting. I can’t verify the data validity of the chosen station. Might want to use an airport or another station that has more consistent data.
This is due to the delta in data we started receiving.
My thoughts on weather stations in general is that if you have one that is either under reporting or over reporting and modify (adjust) flex daily accordingly to how your yard is doing, everything will relatively work itself out.
Now, if you’ve modified your flex daily schedule, and your station starts to report very different data (or in this case missing data) then you will see large variations as you are witnessing.
I won’t normally do this but exported your observed weather data to show the impact of the data change (absent solar radiation).
Which ET value is closer/better (with/without solar radiation)? Without doing a lot more analysis I can’t say. If the solar radiation was bogus or not…