Being able to look at a graph for each zone is nice, but it would be nicer if we could choose to view all of the zones, either overlaid on one graph with different color lines or even just on one page with multiple zones shown independently but on one page.
1 Like
@InmatesRunThePlace, great idea! We were actually bouncing around this idea in the office last week. Not sure how it will look yet, but I’m sure a “consolidated view” will be coming soon.
Just curious, did you have any confusion understanding Flex schedules and how/when they water? @leftride feel free to comment too ![]()
Best, Emil
I haven’t figured it out yet (Flex schedules: what day, what start time, how long, and how many cycles), but made a good ‘dent’ toward figuring it out today today.
Best wishes,
Bill
@a0128958, thanks for the reply. I’ll do my best to answer below:
- What day? You set the “Allowed Watering Days” – Flex schedules can run on ANY of the days selected. For details, please see this support article on how to create a Flex schedule.
- Start time? You set this; the default start time is 5a unless otherwise changed. Flex schedules perform a weather check 1-2 hours before this start time on allowed days to calculate if your moisture levels will hit 0%.
- How many cycles: This is determined by your soil, nozzle (precip) and slope settings. For details, please see this support article to learn more about Smart Cycle.
Hope this helps ![]()
Best, Emil
It does. Thx.
I didn’t realize that soil moisture getting to zero is only a once per day computed number. And that the computation is done 1-2 hours before ‘start time.’ Now I understand what ‘start time’ really means in the context of a flex schedule.
Best regards,
Bill
Any recommendations on ways to improve this understanding for other users?
Yep. Implement the suggestion made by someone else recently: provide context help when cursor arrow is above a field. A few lines for each field could make a real difference.
Thanks. Bill
I did have a point where I was confused by flex scheduling and then it clicked. I think if there was a marketing level page that was even as direct as “Why water just because it is Wednesday?” would really help me understand. The term flex, although technically accurate, doesn’t really describe what it is unless you understand it what it is. Make sense? Maybe call it something like [quote=“emil, post:9, topic:1683”]
webpage
[/quote]
Yes. Can I suggest something that indicates that the “needed” is calculated?
@a0128958, agreed.
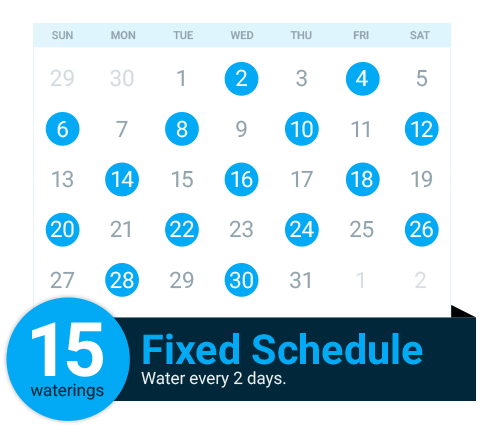
@InmatesRunThePlace, do you think this webpage and/or image helps?
Yes, I think that hits it pretty well. Can I suggest something that indicates that the “needed” is calculated?
Certainly. Do you think displaying dates is needed at all? Perhaps just displaying the moisture is a better option? Less confusion around what date we forecast the next watering time might take place…
I think that’s a good idea. Maybe have marketing thinking through a couple of different options and bounce them through here? 
Now that I’ve had my Rachio a couple of weeks,
+5000 to:
InmatesRunThePlace said: “Being able to look at a graph for each zone is nice, but it would be nicer if we could choose to view all of the zones, either overlaid on one graph with different color lines or even just on one page with multiple zones shown independently but on one page.”
It’s over a million key strokes (I know this is an exaggeration but not by a lot) to look over all of the graphs a few times, make some judgments, make some corrections, and look the graphs over again.
Thank you.
Best regards,
Bill
Thanks @a0128958. I’ve got this down and we’ll discuss.