We’ve just gone through 3 days of 90+ and I have many flower beds and lawn areas that are parched. Unfortunately my mother had just passed away, so I wasn’t paying attention. I have multiple zones which haven’t run at all this month and have Soil Moistures in the single digits. Needless to say, my wife isn’t happy.
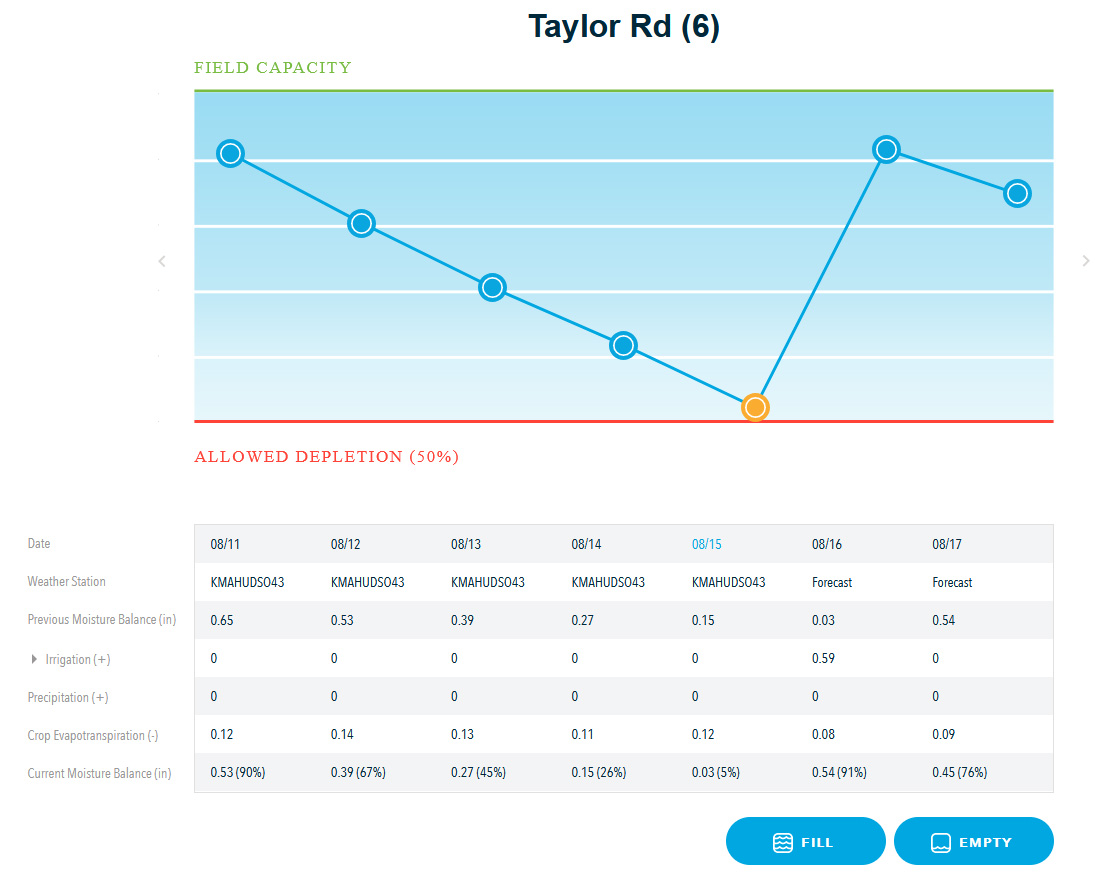
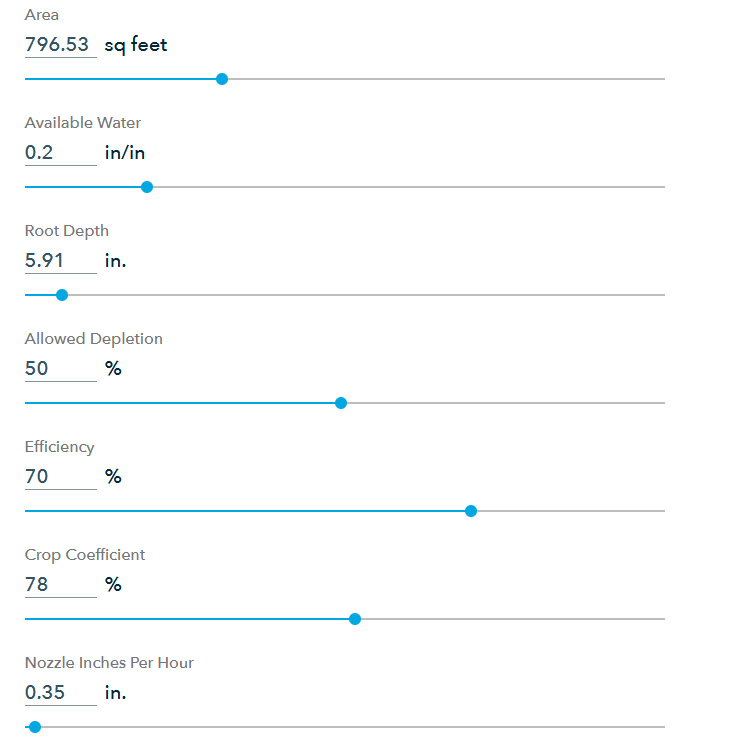
Here are the settings for a typical lawn zone and the water depletion graph. All of the zones are on flex schedules with no rules. What am I doing wrong? Note that there are multiple weather stations within a mile of me, with the closest (KMAHUDS043) 0.4 miles away.
I’ve placed measuring cups to collect actual data, and this is what I see. If anything, I should be over-watering based upon a low of inches-per-hour.
The weather station that the system is utilizing is at a TV tower, with very high-grade equipment which very closely matches what I see. As I stated in my OP, it’s only 0.4 miles from here.
Your available water seems on the high side, root depth and Allowed Depletion are giving lots of water at once. IF your Nozzle flow is low, it would be giving you more water, not less.
Crop Coefficient seems fine.
My condolences.
If they haven’t run this month, it must be due to rain you’ve received, because looking at the graph, you had to have received water on 08/10, either by irrigation or rain, because on 8/10 your Moisture Balance was 0.65" (110% moisture).
Since then, the system has worked as expected per the graph, and the system is due to water tomorrow (8/16).
Your Crop Evapotranspiration levels seem a bit low if your temperature has been in the 90s. Here in SC our temperatures have been in the mid 90s, but our ET values are close to twice yours. I’m using 85% Crop Coefficient compared to your 78% but it’s not that different.
From what I see, things look set up about right. You might increase your Crop Coefficient some, which will force watering more often and give the lawn more total water.
BTW, I can’t get a report from KMAHUDS043 on www.wonderground.com. Where are you located? I’d like to check the FRET values for your area and compare it to the ET values.
All of the advanced settings, other than Nozzle Inches per Hour, are the defaults that Rachio supplied based upon (I assume) the basic settings. The only thing different about this zone is that its Exposure is Lots of Shade, compared to most being Lots of Sun or Some Shade.
One of the things that I really don’t understand is the Allowed Depletion setting and how that relates to Available Water and the Current Moisture Balance. Can someone enlighten me?
You should confirm or set your actual soil type; the default settings cannot know what type of soil you have, and that is important.
I noted above that your ET values seem low for the temperatures you’re having. While today’s high in Hudson is nearer 80 degrees, I see you had temps in around 90 for Wednesday through Saturday. Ours ranged from 91 to 95 for the same period. Yet your ET values for those days were -.11" to 0.14", while ours were 0.15" to 0.21", a lot higher. But yours is in shade, so that would lower it. Just talking out loud here, trying to see what might be amiss.
Ah, I see that you have Available Water set for 0.2", which is appropriate for Clay Loam. But according to the STATSGO soil texture on NLDAS grid, it looks to me like you have Sandy Loam soil, with an AV of only 0.12". If that is true, then you have basically been overwatering, resulting in runoff, on the days you water, meaning less water is stored in the ground, so your grass will dry out sooner. I think that may be your main problem, so suggest you confirm your soil type and set it accordingly.
BTW, just because Rachio comes up with a particular soil type for a zone doesn’t mean it’s the default, any more that sprinkler head type is; you have to make the zone settings according to the environment
Quite simply, with your 5.9" of root depth, that depth will hold 5.9" x the Available Water inches of water. Setting Allowed Depletion to 50% means you intend to let 50% of that water deplete (get used) before watering again. A lower percentage waters more often, but with less water; a higher percentage waters less often, but with more water. 50% is the recommended value and is good for lawns.
Believe me, we have clay/loam. Even the loam that you get is clay/loam. There is no runoff when it runs. The soil type varies tremendously around here. Within a 1/4 of a mile it’s sand. Glacial activity deposited lots of varying soil.
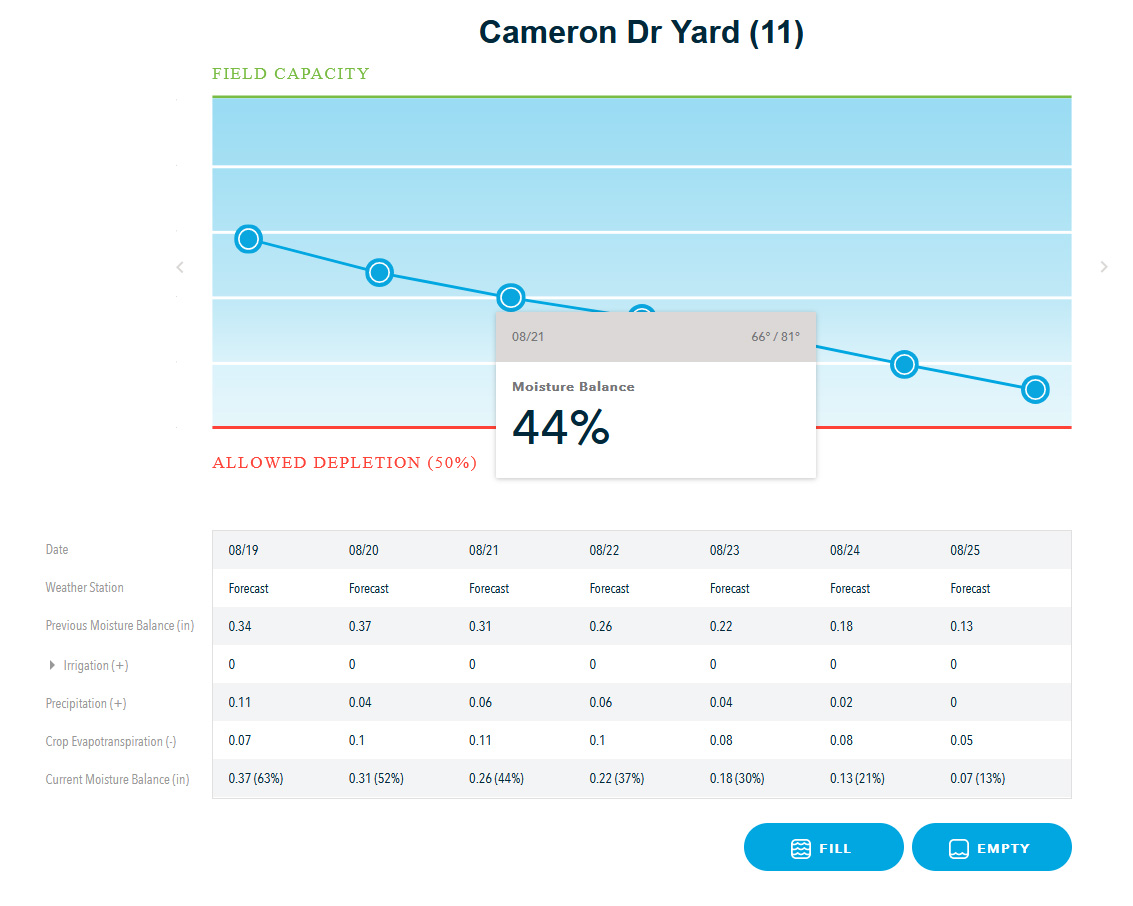
I’m looking at another zone that shows the moisture level working its way down. The allowed depletion is 50%. On 8/21 it drops to 44%. I would have expected that the zone would have run that day or on the 22nd. What am I missing?
Nothing. I gave you the simple version. With 50% depletion, Rachio allows the moisture in the total soil to the roots to go from 100% moisture down to 50% moisture. But Rachio is only interested in that upper 50% part, so when it’s full, it’s shown as 100%. And when it’s empty (time to water, 50% depletion used up), it’s shown as 0%. I think it’s confusing, but believe they are using terminology used by the industry.
Looks like you’ve got moderate weather forecast, with a little rain each day, so it will take a while for it to need to water again.
I’m an engineer and a web site developer, and I’m just confused by what’s being displayed and what the Allowed Depletion parameter means.
Let’s say that I have a zone with 1" of Moisture Balance and that reads 100% on the field capacity chart. The Allowed Depletion is 50%. Each day the Crop Evapotranspiration is 0.1", so the Moisture balance would read:
At this point I would expect the zone to run because the Allowed Depletion has dropped below 50%. Is that correct? If not, what are these Moisture Balance percentages that are being displayed?
When I change the Allowed Depletion value and then go and look at the Field Capacity graphs, I would expect it to change as to when the zone runs. I don’t see any change.
0% moisture equals 50% AD. 100% (technically 110%) is max capacity of the soil. If you change AD to 30%, that is now your 0% moisture level, and 100% is still max. It’s a sliding scale if you will…
The percent is of the AVAILABLE moisture up to the Allowed Depletion. Not of the TOTAL moisture in the zone. Here are 3 tables with 3 different Allowed Depletions that I hope will explain it:
50%
Allowed Depletion
Total Moisture in,
Total Moisture, %
Moisture Balance in,
Moisture Balance, %
1.00
100%
0.50
100%
0.90
90%
0.40
80%
0.80
80%
0.30
60%
0.70
70%
0.20
40%
0.60
60%
0.10
20%
0.50
50%
0.00
0%
30%
Allowed Depletion
Total Moisture in,
Total Moisture, %
Moisture Balance in,
Moisture Balance, %
1.00
100%
0.30
100%
0.90
90%
0.20
67%
0.80
80%
0.10
33%
0.70
70%
0.00
0%
70%
Allowed Depletion
Total Moisture in,
Total Moisture, %
Moisture Balance in,
Moisture Balance, %
1.00
100%
0.70
100%
0.90
90%
0.60
86%
0.80
80%
0.50
71%
0.70
70%
0.40
57%
0.60
60%
0.30
43%
0.50
50%
0.20
29%
0.40
40%
0.10
14%
0.30
30%
0.00
0%
The two Total Moisture columns represent the total water in the full root depth of the zone, and corresponds to what you posted. The second two columns labeled Moisture Balance are what Rachio would show in their graph.
Thanks for the clarification, but I have to say that this is just about as transparent as mud. I now see what they’re doing, but I fail to see why the Field Capacity graph just can’t be displayed showing values that are 100% of actual with a red line (Allowed Depletion) showing that when the moisture balance drops below it, that the zone runs. Data needs to be presented to the user in an understandable format, and not some obtuse format. I wonder how many users of this system understand what that graph means.
It also doesn’t help that if you change the Allowed Depletion, that the graphs don’t change until you exit the zone and re-enter it. I was making changes, as nothing was changing.
[quote=“geoffschultz, post:12, topic:32122”]
Data needs to be presented to the user in an understandable format, and not some obtuse format.[/quote]
It’s done that way because it’s an industry standard. If you look up similar information on other sites for determining moisture, that’s the way they use it. If Rachio made up their own method, even if more understandable, it would conflict with those sites, and a lot (of other) people would be confused.
I think a good many. Not in absolute terms, but that’s not necessary. When the graph is close to the top, the zone is pretty full. When it’s close to the bottom, it’s time to water. Doing it the “simple” way just showing absolute % water would then require changing when it should water. Once you’ve set it, you can just look at it and easily understand it, IMHO.
There are several areas that don’t update as well or often as they should. They should be fixed. But changing something like Allowed Depletion can be confusing: Are you changing the value you’ve been using all along to a better value, so need to recalculate everything already done? Or are you changing to a new value based on changes in your conditions, and should only recalculate what’s going forward. This can be confusing (and can confuse the program as well).