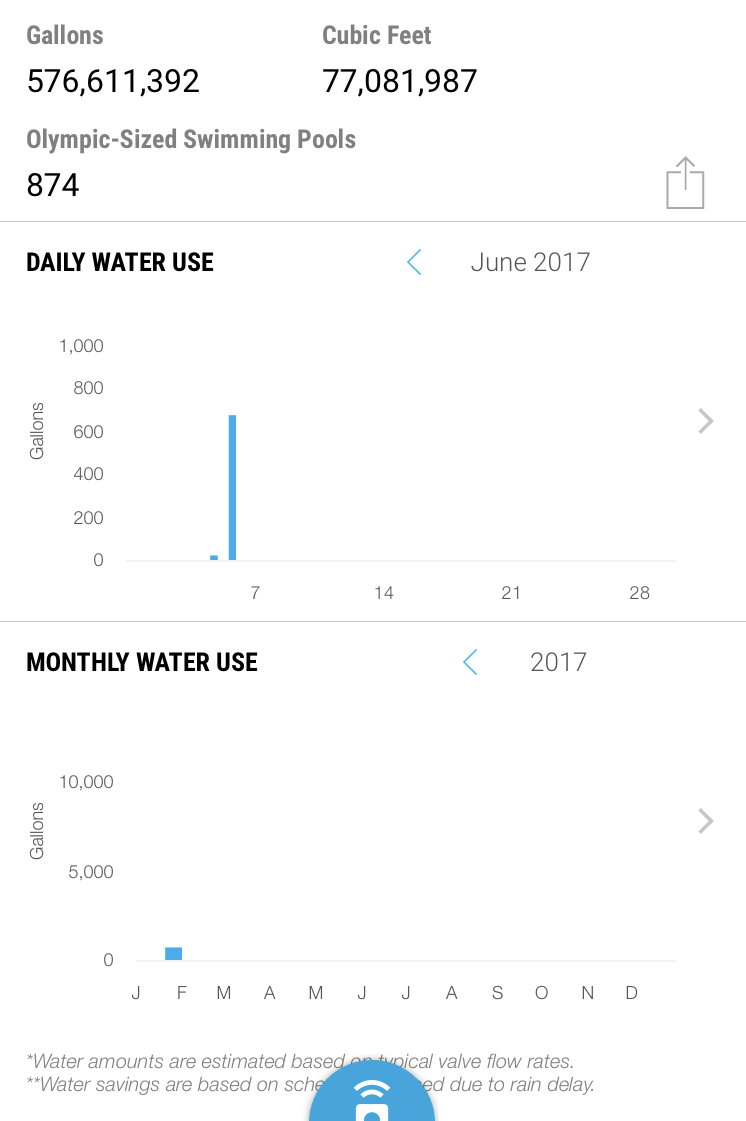
On my iOS app only, my Monthly Water Usage chart seems to be shifted by several months. I started watering with my new Rachio in June 2017 yet the chart appears to show water usage in February only. On the web app the Watering History chart appears correct.
1 Like
Hey @ldslaron-
This is an known defect with our iOS app that our development team is aware of. I am sorry for any inconvenience it may cause! In the mean time, I recommend viewing your usage on the web app. It also typically resolves itself the following month and begins displaying correctly!
McKynzee 
1 Like
Thanks for the reply. I also noticed that the daily graph on iOS might be using UTC time instead of local time since it starts to fill up the graph for the next day before the end of my local day.
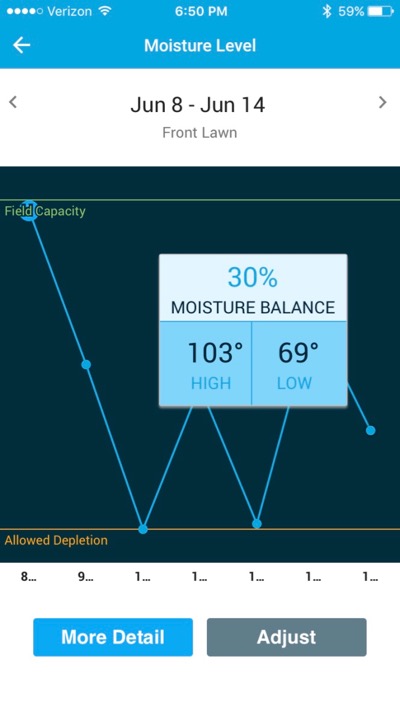
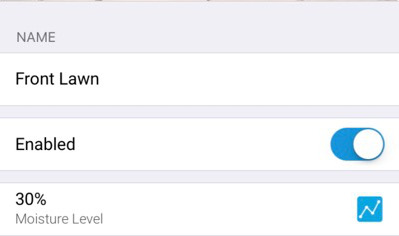
Incidentally it also looks like the moisture level field in the Zone Details screen on iOS may also be shifted in time by a few hours. For example, currently (on June 7 local time), it lists the moisture balance predicted for tomorrow (June 8).
Here are some screenshots of the moisture level in the iOS app from June 13th. The moisture level on the zone screen (30%) conflicts with the moisture level in the graph for the 13th (65%), but instead corresponds with the moisture level in the graph for the 14th (30%). This behavior seems to happen only late in the day, implying possibly a UTC vs. local time problem in the app.