Hi, I have selected the Davis weather station on my property to provide data to my new Rachio (since 25 May). It contributes data to Wunderground and APRS (CWOP) and so appears as station MID_C7488 through the CWOP system. It’s been dry here recently (I live about 20 miles SW of London, England) but it has rained yesterday and today. Yesterday Rachio put in 3cm rain when the actual figure was 6mm! The weather station appears on the gladstone family site and the reported data on the Findu site referenced on the gladstonefamily site is correct. Any idea what might be going wrong?
Seems CWOP is interpreting your data differently from Weather Underground
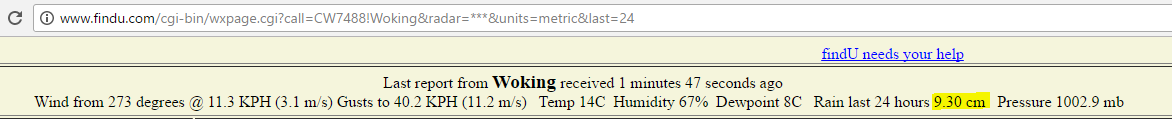
http://www.findu.com/cgi-bin/wxpage.cgi?call=CW7488!Woking&radar=***&units=metric&last=24
From CWOP: Rain last 24 hours 9.70 cm
More details here:
http://www.findu.com/cgi-bin/wx.cgi?call=CW7488&units=metric
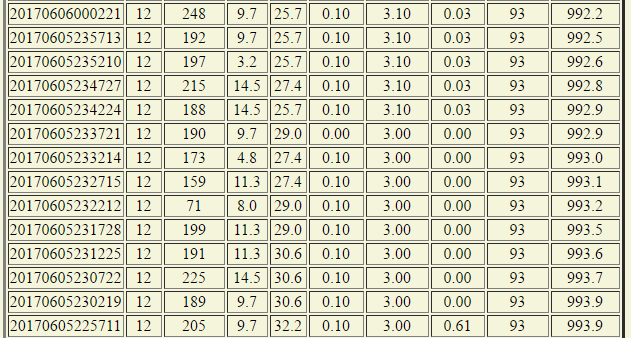
Note the line at the end of the 5th:
20170605225711 12 205 9.7 32.2 0.10 3.00 0.61 93 993.9
You can see that CWOP is doing something funky with data interpretation.
https://www.wunderground.com/personal-weather-station/dashboard?ID=ISURREYW4#history/s20170605/e20170612/mweek
As of this moment WU is reporting 0.77 in for this week, which is equivalent to past 24 hours, which is 1.96 cm
Since Rachio is getting data from CWOP, you are stuck with their interpretation which is almost 5x that of weather underground. If you believe that weather underground has a better interpretation, you could port the data to pwsweather for free and use that. More info here (link)
Cheers,
Gene
1 Like
I’m not sure we’re looking at the same thing here. The findu site (CWOP) shows me 6mm on the 5th as does Wu. I may not be seeing the same thing as you as I have settins for metric units. Here are the pics I am seeing (Findu then WU).
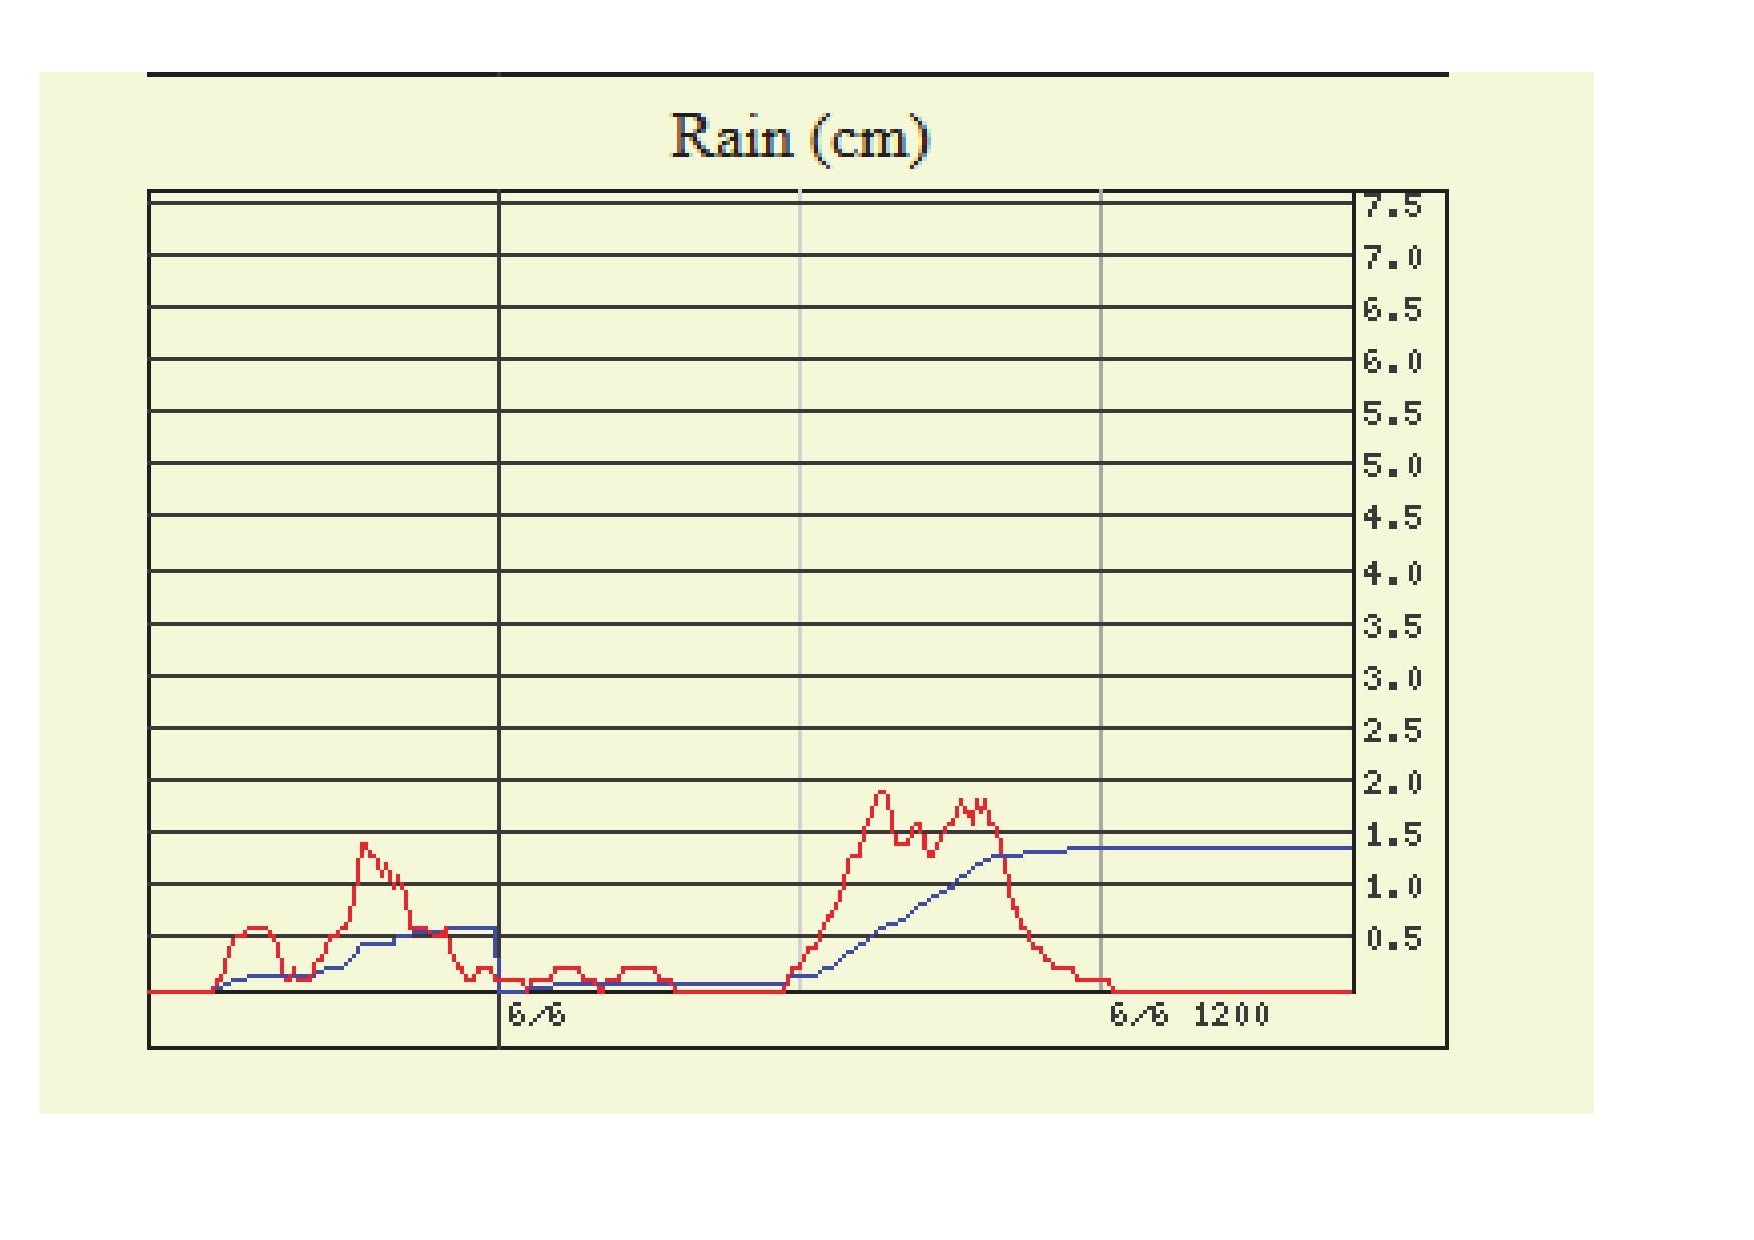
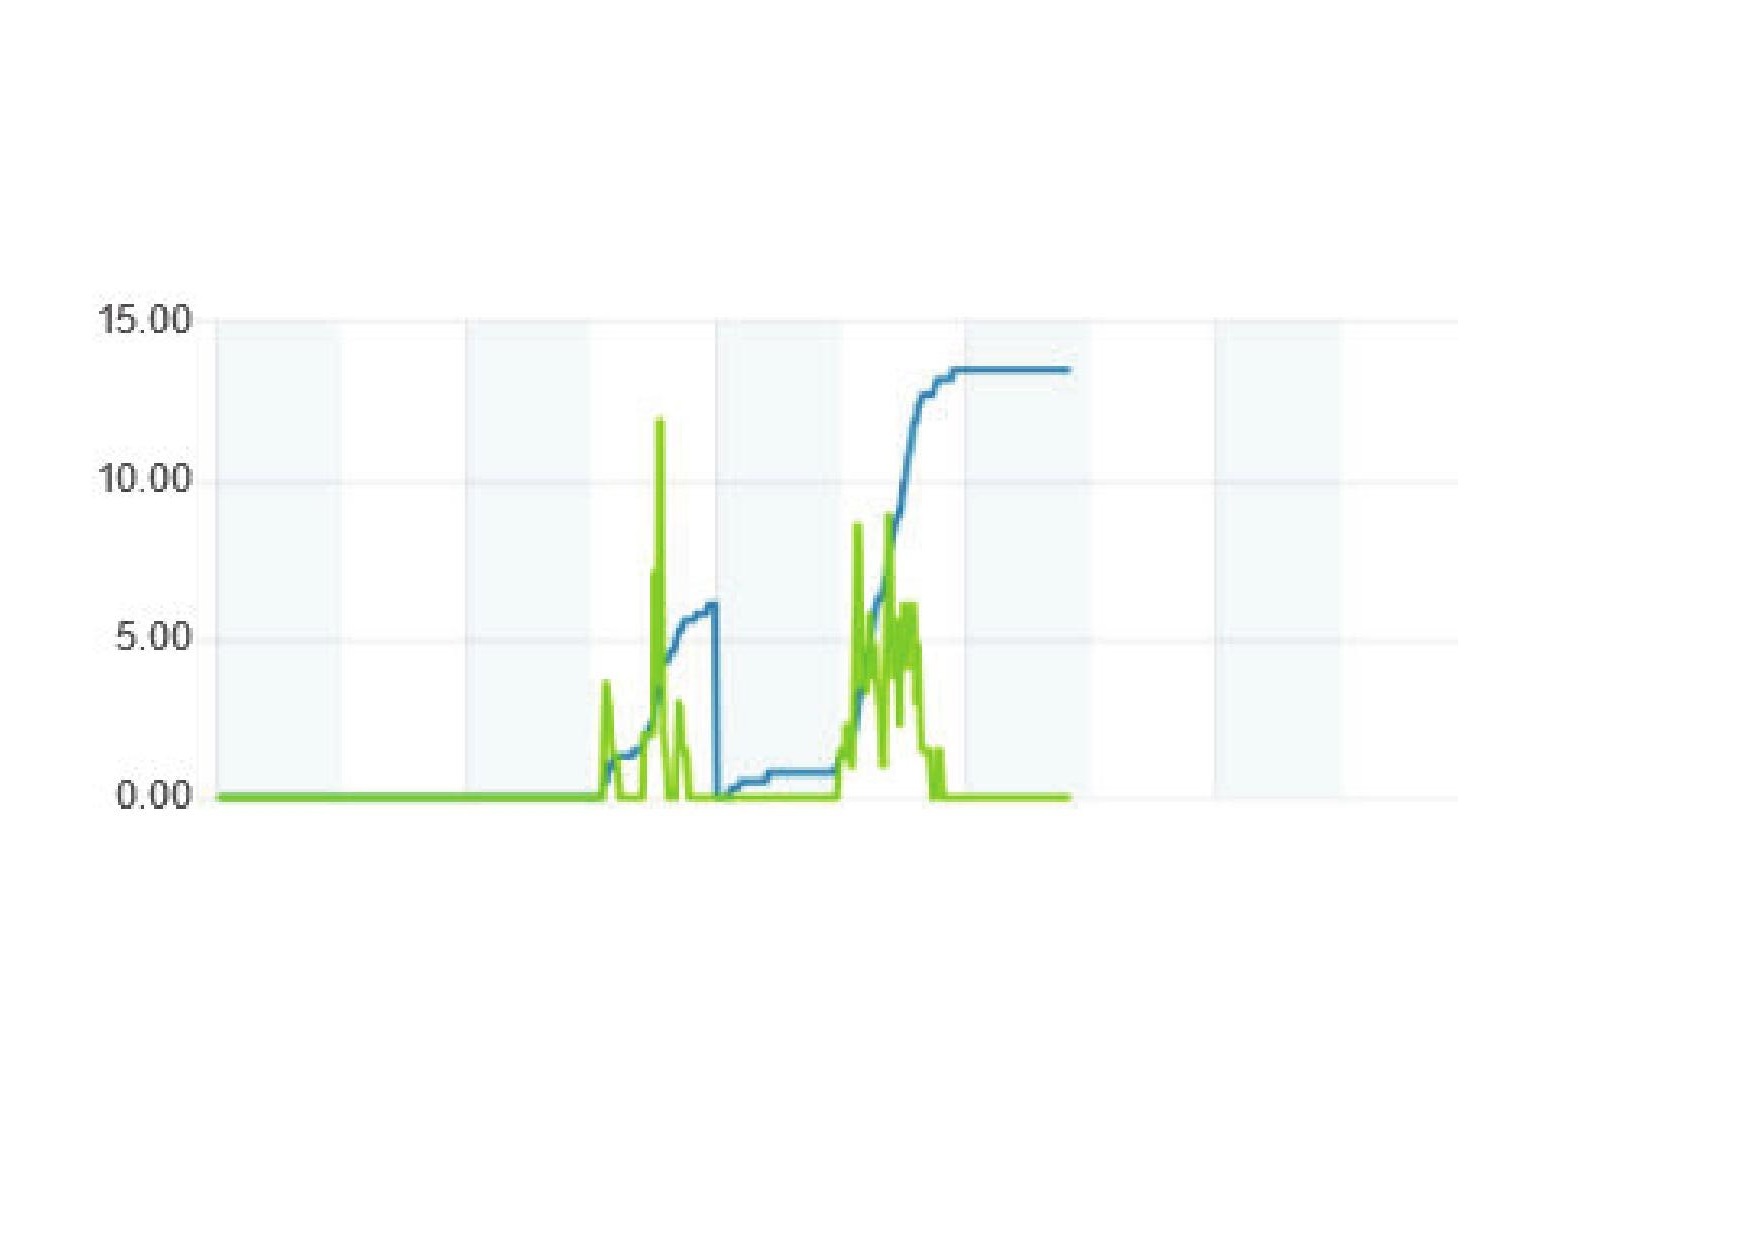
That’s showing me 6mm yesterday and 13.8mm today (whichj is whjat the Davis console is saying too).
What’s more, my Rachio has plugged in 0.2cm forecast rain for today when we have already had 1.38cm!
I’m looking at the information displayed on the CWOP/findu header:
On the detailed page, you can see that what ever “rain mn” parameter is, it is interpreted as much more rain (0.3mm of “mn” results in full 1mm of recorded rain).
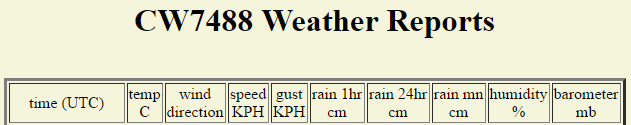
…
Note that Rachio seems to be using “rain 24hr” parameter, not “rain mn” (not sure what “mn” stands for). One thing of note is that what ever that mn parameter is, it got reset a full hour before midnight.
Gene
I’ve been in touch with CWOP support at NOAA. Rain mn is the rain accumulation since midnight local time and in the CWOP system (looking at the table above) resets at 2300 implying that CWOP works on UTC because my local time is BST (=UTC +1). In the table above Rain mn was reset after the 20170605225711 reading which showed 0.61cm - the same as the weather station figure of 6mm (I guess the difference is rounding from cm to in to cm conversions). However, the Rain 24 figure is a rolling 24 hour figure and should therefore be the same as the Rain mn just before reset and this is clearly not the case - it is showing 3.0cm. I have explained this to CWOP support and requested an explanation.
1 Like
It seems your station is sending wrong data as per CWOP FAQ:
From Forums & FAQ for CWOP question 7:
The letter “r” followed by 3 numbers represents the amount of rain in hundredths of inches that fell the past hour. The letter “p” followed by 3 numbers represents the amount of rain in hundredths of inches that fell in the past 24 hours. Only these two precipitation values are accepted by MADIS. The letter “P” followed by 3 numbers represents the amount of rain in hundredths of inches that fell since local midnight.
From the raw data your station is sending, visible here (link):

which is decoded as:
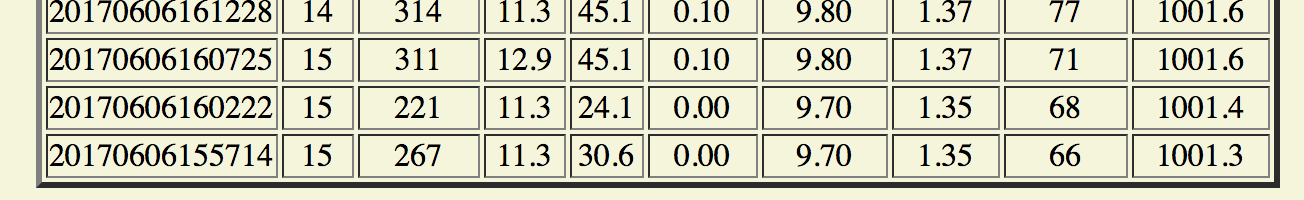
Note that topmost RAW data is the oldest, thus seen at the bottom of the decoded list. Look for the 3rd RAW data from the top, and the 3rd decoded data from the bottom. On 06/06 at 16:07 your station has reported:
r value increase: 004; p value increase: 004 (from 382 to 386);
P value increase: 001 (from 053 to 054);
All of these suppose to be 1/100th of an inch, which means Davis has reported increase of 1.016 mm for 1hr rain and 24hr rain data and reported 0.254mm increase for midnight (mn) rain data. Since P (midnight) data is not accepted by MADIS, rachio does not see it.
Also note that p value of 386 (of 1/100th of an inch) equates to 98.04mm, which matches CWOP 9.80 cm exactly.
Looks like the issue could be with Davis, not CWOP.
Gene
Gene,
Thanks for your careful detective work. Sorry for the delay in responding but I was tied up and your points needed careful thought. I had already raised the issue with NOAA / CWOP support (no reply yet) but suspect that if the data strings are truly raw from the submission they’ll come back to say (as you suggested) it’s an issue at my end. I have just emailed Davis support explaining the issue and will see what happens.
In the meantime I have rebooted the weather station, reinstalled the Davis Weatherlink software…but have had no rain to see if this has had an effect. I have also as a plan B set up your cron-job arrangement to reactivate the PWS account I used when I had a different weather station and the data seems to be transferring nicely. I’ll switch my Rachio to the PWS instance of my weather station to see if my station uploads weather data via Wunderground in a more useful way.
1 Like
I do hope that Davis or CWOP will be able to resolve the issue. Please keep us informed 
Cheers,
Gene
Yeah, I talked to Davis today and they’re going away to think about it. Is there any way to see the equivalent ‘raw’ upload data on PWS? I want to see if the same is happening in the uploads going via Wunderground (which comes via a different module - an add-on - in the Davis WeatherLink software and then wufyi / cron-job)? I switched the weather station used on my Rachio to the PWS instance and it shows for 8 June 0.05cm (or 0.5mm) - which is correct! Hurray! I’ll continue to monitor…
There are no raw data conversions with weather underground / PWSweather. What you see is what you get.
Information on how Weather Underground recieves data from your PWS, can be found here (link).
As far as data wufyi can provide, here is info from today at 10:30AM your time:
Data from WU
{
“response”: {
“version”:“0.1”,
“termsofService”:“http://www.wunderground.com/weather/api/d/terms.html”,
“features”: {
“conditions”: 1
}
}
, “current_observation”: {
…
“estimated”: {
},
“station_id”:“ISURREYW4”,
“observation_time”:“Last Updated on June 9, 10:30 AM BST”,
“observation_time_rfc822”:“Fri, 09 Jun 2017 10:30:07 +0100”,
“observation_epoch”:“1497000607”,
“local_time_rfc822”:“Fri, 09 Jun 2017 10:30:31 +0100”,
“local_epoch”:“1497000631”,
“local_tz_short”:“BST”,
“local_tz_long”:“Europe/London”,
“local_tz_offset”:"+0100",
“weather”:“Rain”,
“temperature_string”:“59.4 F (15.2 C)”,
“temp_f”:59.4,
“temp_c”:15.2,
“relative_humidity”:“86%”,
“wind_string”:“From the WSW at 4.0 MPH Gusting to 5.0 MPH”,
“wind_dir”:“WSW”,
“wind_degrees”:257,
“wind_mph”:4.0,
“wind_gust_mph”:“5.0”,
“wind_kph”:6.4,
“wind_gust_kph”:“8.0”,
“pressure_mb”:“1010.7”,
“pressure_in”:“29.85”,
“pressure_trend”:"-",
“dewpoint_string”:“55 F (13 C)”,
“dewpoint_f”:55,
“dewpoint_c”:13,
“heat_index_string”:“NA”,
“heat_index_f”:“NA”,
“heat_index_c”:“NA”,
“windchill_string”:“NA”,
“windchill_f”:“NA”,
“windchill_c”:“NA”,
“feelslike_string”:“59.4 F (15.2 C)”,
“feelslike_f”:“59.4”,
“feelslike_c”:“15.2”,
“visibility_mi”:“3”,
“visibility_km”:“5”,
“solarradiation”:“74”,
“UV”:“4”,“precip_1hr_string”:“0.31 in ( 8 mm)”,
“precip_1hr_in”:“0.31”,
** “precip_1hr_metric”:" 8",**
“precip_today_string”:“0.04 in (1 mm)”,
“precip_today_in”:“0.04”,
** “precip_today_metric”:“1”,**
“icon”:“rain”,
“icon_url”:“http://icons.wxug.com/i/c/k/rain.gif”,
“forecast_url”:“http://www.wunderground.com/global/stations/03766.html”,
“history_url”:“http://www.wunderground.com/weatherstation/WXDailyHistory.asp?ID=ISURREYW4”,
“ob_url”:“http://www.wunderground.com/cgi-bin/findweather/getForecast?query=51.319027,-0.540250”,
“nowcast”:""
}
}
[details=Data to PWSweather]
http://www.pwsweather.com/pwsupdate/pwsupdate.php?
ID=UKWOKIN1&PASSWORD=*******&
dateutc=2017-06-09+09:30:07&
winddir=257&windspeedmph=4&windgustmph=5.0&tempf=59.4&
rainin=0.31&dailyrainin=0.04&
baromin=29.85&dewptf=55&humidity=86&softwaretype=ebviaphpV0.3&action=updateraw[/details]
Note I’ve added new lines to PWSweather update to make it easier to read.
Gene
Thanks Gene. In your PWS data dailyrainin looks like rain since midnight, and rainin is the 1 hour number (which looks bad - consistent with something wrong at the Davis weather station end). Either way they look equally inconsistent. But oddly when I use PWS as my Rachio weather station the number in Rachio looks good but when I use MID_ it doesn’t. I infer that since MID ignores the rain since midnight data that route is using the corrupt 24 hour number but the Rachio uses the rain since midnight figure from PWS (which is correct) since a rolling 24 hour number does not appear to be transferred from WU to PWS. I’ve sent more data to Davis and they say they’ll look at it today or Monday.
1 Like
Thanks for catching that, since you mentioned earlier that rain data seems to be good, I didn’t even think to analyze it in detail, just retrieved it and posted it here.
I also noticed you had an unexpected blip at 5:21PM yesterday, I’ll see what I can do to make sure it doesn’t happen again (for you or anyone else).
Thanks,
Gene
I’m not sure what I caught but please don’t switch the data point posted from WU to PWS from the day to date to the rolling 24 hour figure or I will be back to square one with bad data in my Rachio! I’ve no idea what the blip was but the weather software fell over at 1 in the morning 10 June and was offline until I noticed at 10 in the morning. I’ve had this instability problem before but only when I am posting to both CWOP and Wunderground - it doesn’t seem to happen when I’m posting only to WU. Since the CWOP data is of no use in Rachio at present because of the bad data bug I’m tempted to revert to posting only to WU until Davis come up with a bug fix
No worries, I’m not in a habit of making things worse  I’ll definitely avoid relying on a known faulty data.
I’ll do some more investigating later over the weekend. Spikes in the data, like you had at 5:21PM on Friday, are usually caused by bad data from WU, not your weather station. I’ll keep you posted of any findings before any changes (if any) are made.
Gene
2 Likes
Hmm. I can’t see that spike in the WU page even allowing for the hour’s difference between GMT on PWS and GMT+1 on WU
But what is weird is the PWS figure for Daily Precip total on 9 June going from 1.3mm to 1.5mm between 10.50pm and 11.00pm and then to 15.7mm at 11.05pm. The equivalent figure on the WU page goes from 0 to 1.5mm between 10.10am and 10.50am and then stays level at 1.5mm for the rest of the day. I think WU displays the data in my local time (GMT+1) and PWS displays GMT time so the period between 11.00pm and midnight on PWS should equate to the first hour of 10 June on WU - when there was no rain!
That is interesting, regarding the weird data at the end of yesterday and the time differences. WU and PWS should be in sync as far as the time goes. I’ll look into it when the time allows and get back to you.
I got a reply from Aeris support regarding the fact that PWS data is displayed on my PC screen in my local time unadjusted for daylight savings. They say that:
“This is an issue related to compensating for daylight saving time for locations outside of the United States. It is on the list to be addressed during an upcoming update”
1 Like
A lot has been going on in the background since my last post and @Gene has suggested I give an update for those of you with Davis Weather stations who might be interested.
The issue was that the Davis Weatherlink software can upload to Weather Undergraound and to APRS/Citizens Weather but not PWS. The upload of the precipitation since last midnight is correct (allowing for rounding errors between mm, which is what my Davis measures in (European version), and inches which is what is uploaded). However, Rachio appears to use the rolling 24 hour figure from APRS/CWOP which Davis have now acknowledge is uploaded incorrectly (about 5x larger than it should be) as is the data point for rain in the last hour. They agree that this is probably because of a bug in the Weatherlink software. They have told me that their resources are currently fully committed and cannot give me an idea of a timeline for this to be fixed…
So, because the data Rachio uses from CWOP is compromised I am using @Gene’s wufyi / cron-job solution to take my station’s data from Weather Underground to PWS and using the PWS instance of my weather station to feed Rachio. There have been some very odd numbers on the PWS website although bizarrely the daily rain number now appearing in my Rachio seems more or less in line with what my Davis is saying before the upload process.
@Gene has been working hard on his wufyi code to sort out the weird numbers appearing in PWS (which I understand were the result of odd things going on in the PWS API) and has a beta under test.
2 Likes