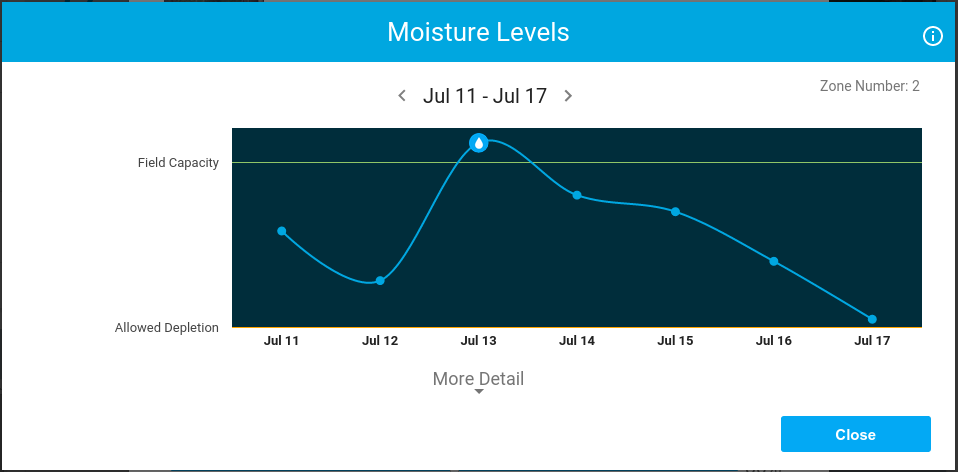
We’ve had feedback on the soil moisture graph in that it doesn’t depict the zone actually reaching depletion, which is correct (visually).
If you notice from July 12th - July 13th my zone was depleted and then irrigated on the 13th. Soon, we will better depict the moisture level hitting depletion on the 12th and irrigating on the 13th. More oscillation by plotting hourly data points. Hope to drop this sometime next week.
This graph shows daily Zone depletion. We track daily evapotranspiration and offset it with irrigation and precipitation events. The bottom of the graph has the raw data points used to plot. This will be in mobile soon, now just in the webapp.
Can you show anticipated moisture level for the next day? Maybe make the line dashed to indicate it is a projection based on forecasted weather.
Thanks for being open to suggestions and quickly implementing things. I work in a R&D facility at a large company and seeing how quickly a small company can implement change is refreshing.
Oh, I didn’t notice it had a forward. I was thinking more like on the graph itself I suppose for the current week. A low priority if you are tracking enhancements in JIRA I suppose.
@InmatesRunThePlace, no worries. Any recommendations on how the graphs could be improved? Hopefully they have been helpful to you in understanding Flex schedules.
I like the graphs and cant wait till they are on mobile. My only issue is that we had 2 days of rain on the 18th and 19th (which did cause a rain delay), but the raw data and graphs do not reflect any precipitation…
Hasn’t rained too much here in California so I will check the next time it does and will let you know. Prior dates still showing 0, but I don’t think those would update retroactively…
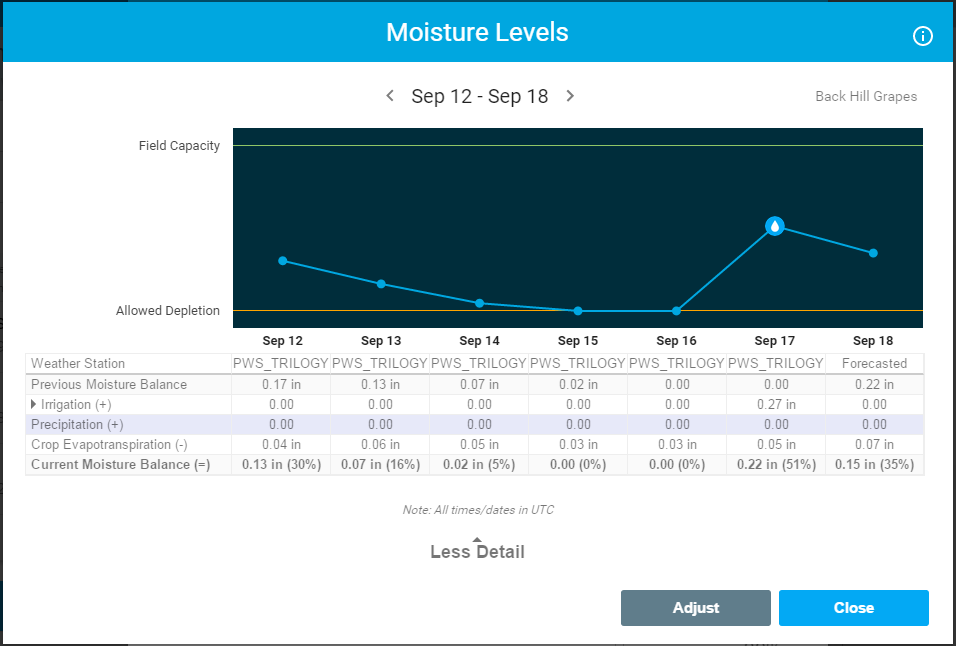
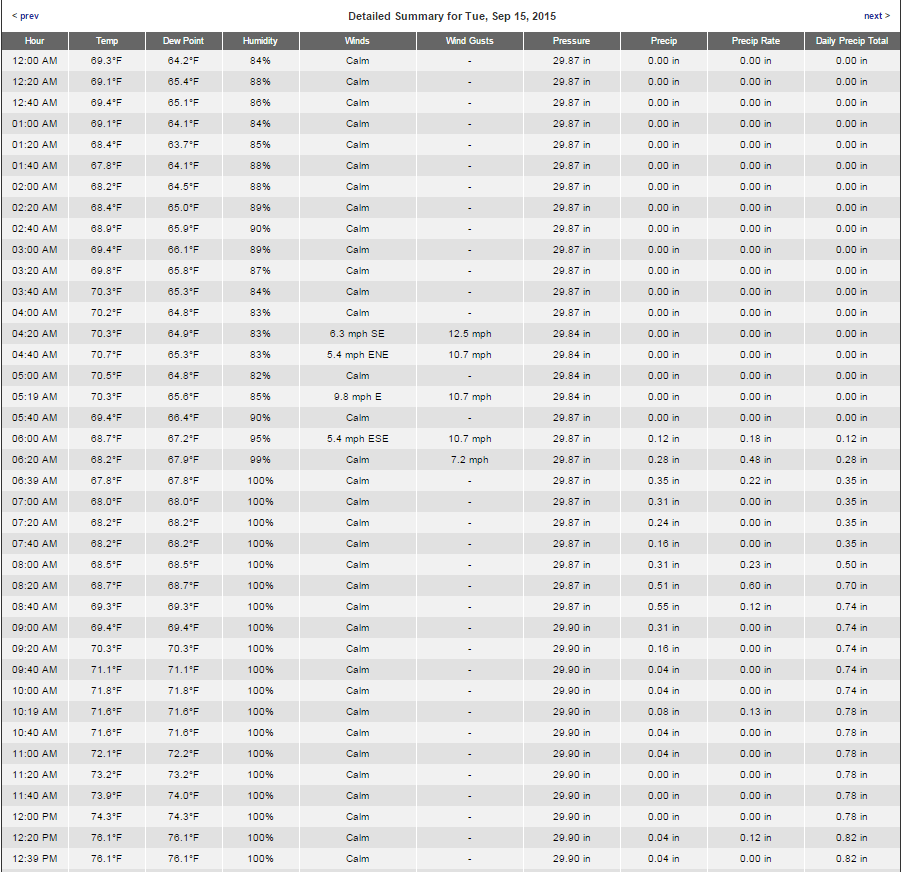
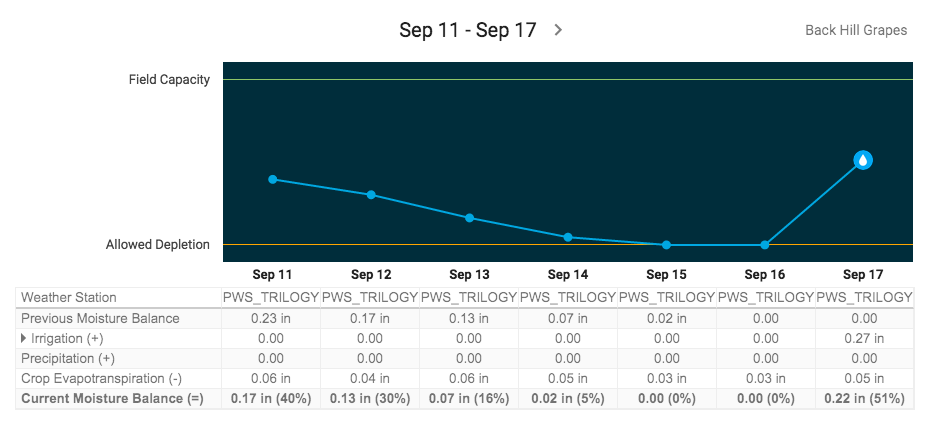
@emil, We had a pretty good rain this week on 9/15. However, my flex scheduled grapes ran as scheduled a day and half later. There is 0 precipitation recorded in any of the moisture graphs.
I manually stopped that half way through the schedule and also turned off my other Fixed schedules, but they all ran at least partially when they really should have delayed.
Looking at the data you provided, and after revisiting your account, it appears there’s a data discrepancy occurring. We’ll need to submit a ticket to our weather service to research the root cause of the discrepancy. Thanks for bringing this to our attention.
I’ve created a ticketing system for these issues going forward so we can forward them to the weather service for review. I’ll fill this out for you @bhochenedel – others in the same boat, please fill out the form to open a ticket.
@bhochenedel, I forgot to attach a few screenshots of your account I took. They show that your weather station is not updating your moisture graph to reconcile between the forecasted and observed weather data. I’m not sure if you have already, but it might not hurt to test a different weather station while yours is under review.
Thanks for your help. I have made the change to the local airport weather station. Hopefully it works out the next time it rains here. Other one is closer to our micro-climate, but I’d rather get some data (even if not as accurate).
@bhochenedel, I just wanted to check in to see how the current weather station has been working for you? Hopefully it’s recording rain better than the PWS was. Please keep us posted of any issues you encounter.