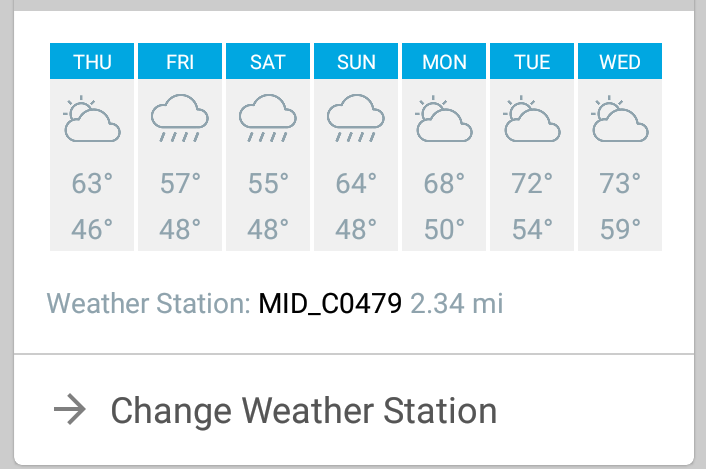
Can you add the forecasted precipitation amounts in between the 7 day forecast and the weather station selection area? The forecast currently shows rain clouds for the next four days. It would be nice to know how much precipitation is expected on those days that display the rain clouds. Currently, Rachio only displays it for the current day.
1 Like
Seems like Rachio’s predictions on rainfall amounts would be as accurate as your local tv meteoroligist. Mine is not the best.
1 Like
If you are using Flex Daily, you can see the predictions on the moisture level charts.
I can see where it would be nice to know for other schedule users.
I think this would probably be even more useful than that % chance of precip and wind speed on the dash… maybe we could replace those with some forecasted precip numbers. Thanks for the feedback @garyjnj1!
Sorry Linn, but I am using a flexible daily schedule. It does not show this. Even the “more detail” section of the graph does not show a forecast of precipitation amounts. It only displays the past seven day history through to today of actual precipitation levels. Here, I am referring to the Android app.
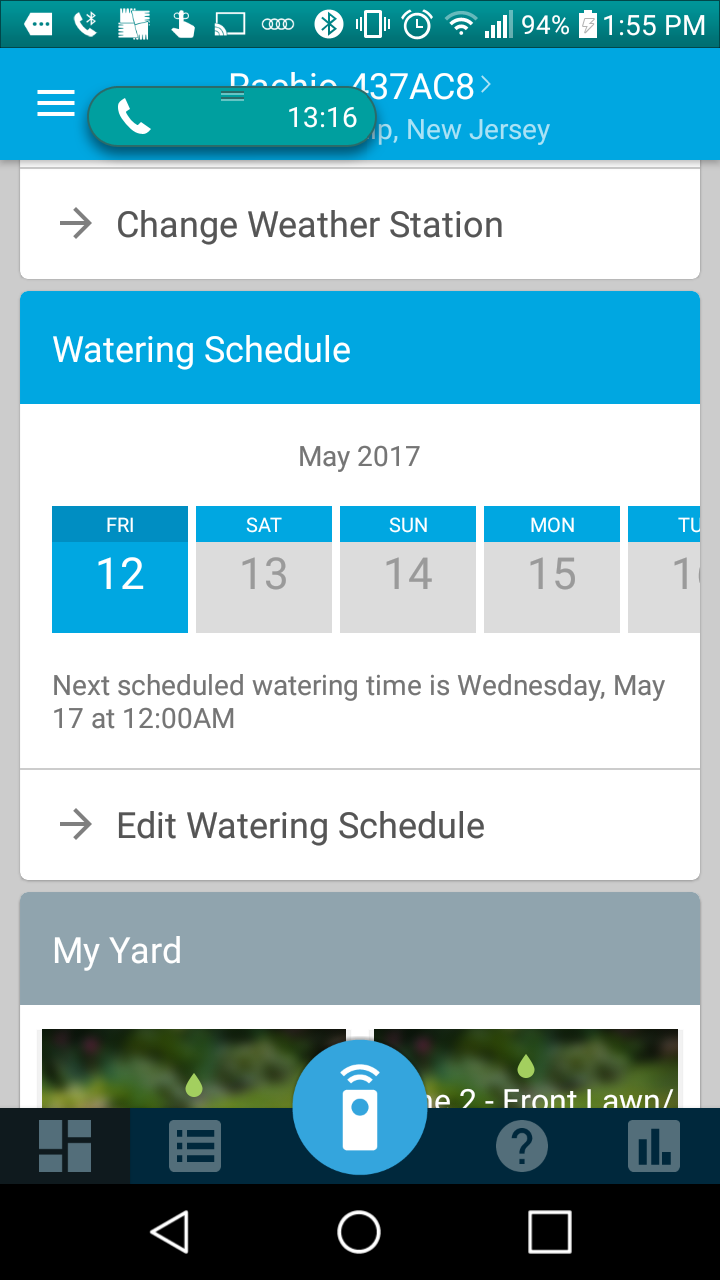
Yes mckynzee, the weather stations are providing that so would be great to have it instantly viewable. Also, where it shows “Watering Schedule” please add the name of the schedule that is being used. So “Watering Schedule” would change to “Watering Schedule: Flexible Daily.” Right now, we have drive down into the app/schedule to see what we are running.
+1 to that @mckynzee, it would be very useful rather than having to drill all the way down into the Moisture level More Detail (@garyjnj1 may have missed that you can get forecast rain on the moisture level screen to get the next week by clicking the forward arrow next to the date range at the top of the screen and then drilling to more detail)
1 Like
Yes WorkingWounded, I now see where you can page to the right or left in the graph to see forecasted moisture levels, However, only the irrigation raindrop shows for Rachio. and not for environmental precipitation. Then you have to drill down to see more detal. In all actuality, a seperate graph line (red) should be plotted on the graph to show precip precipitation from actual rain and forecasted rain. This would be in addition to the other suggestion.
1 Like