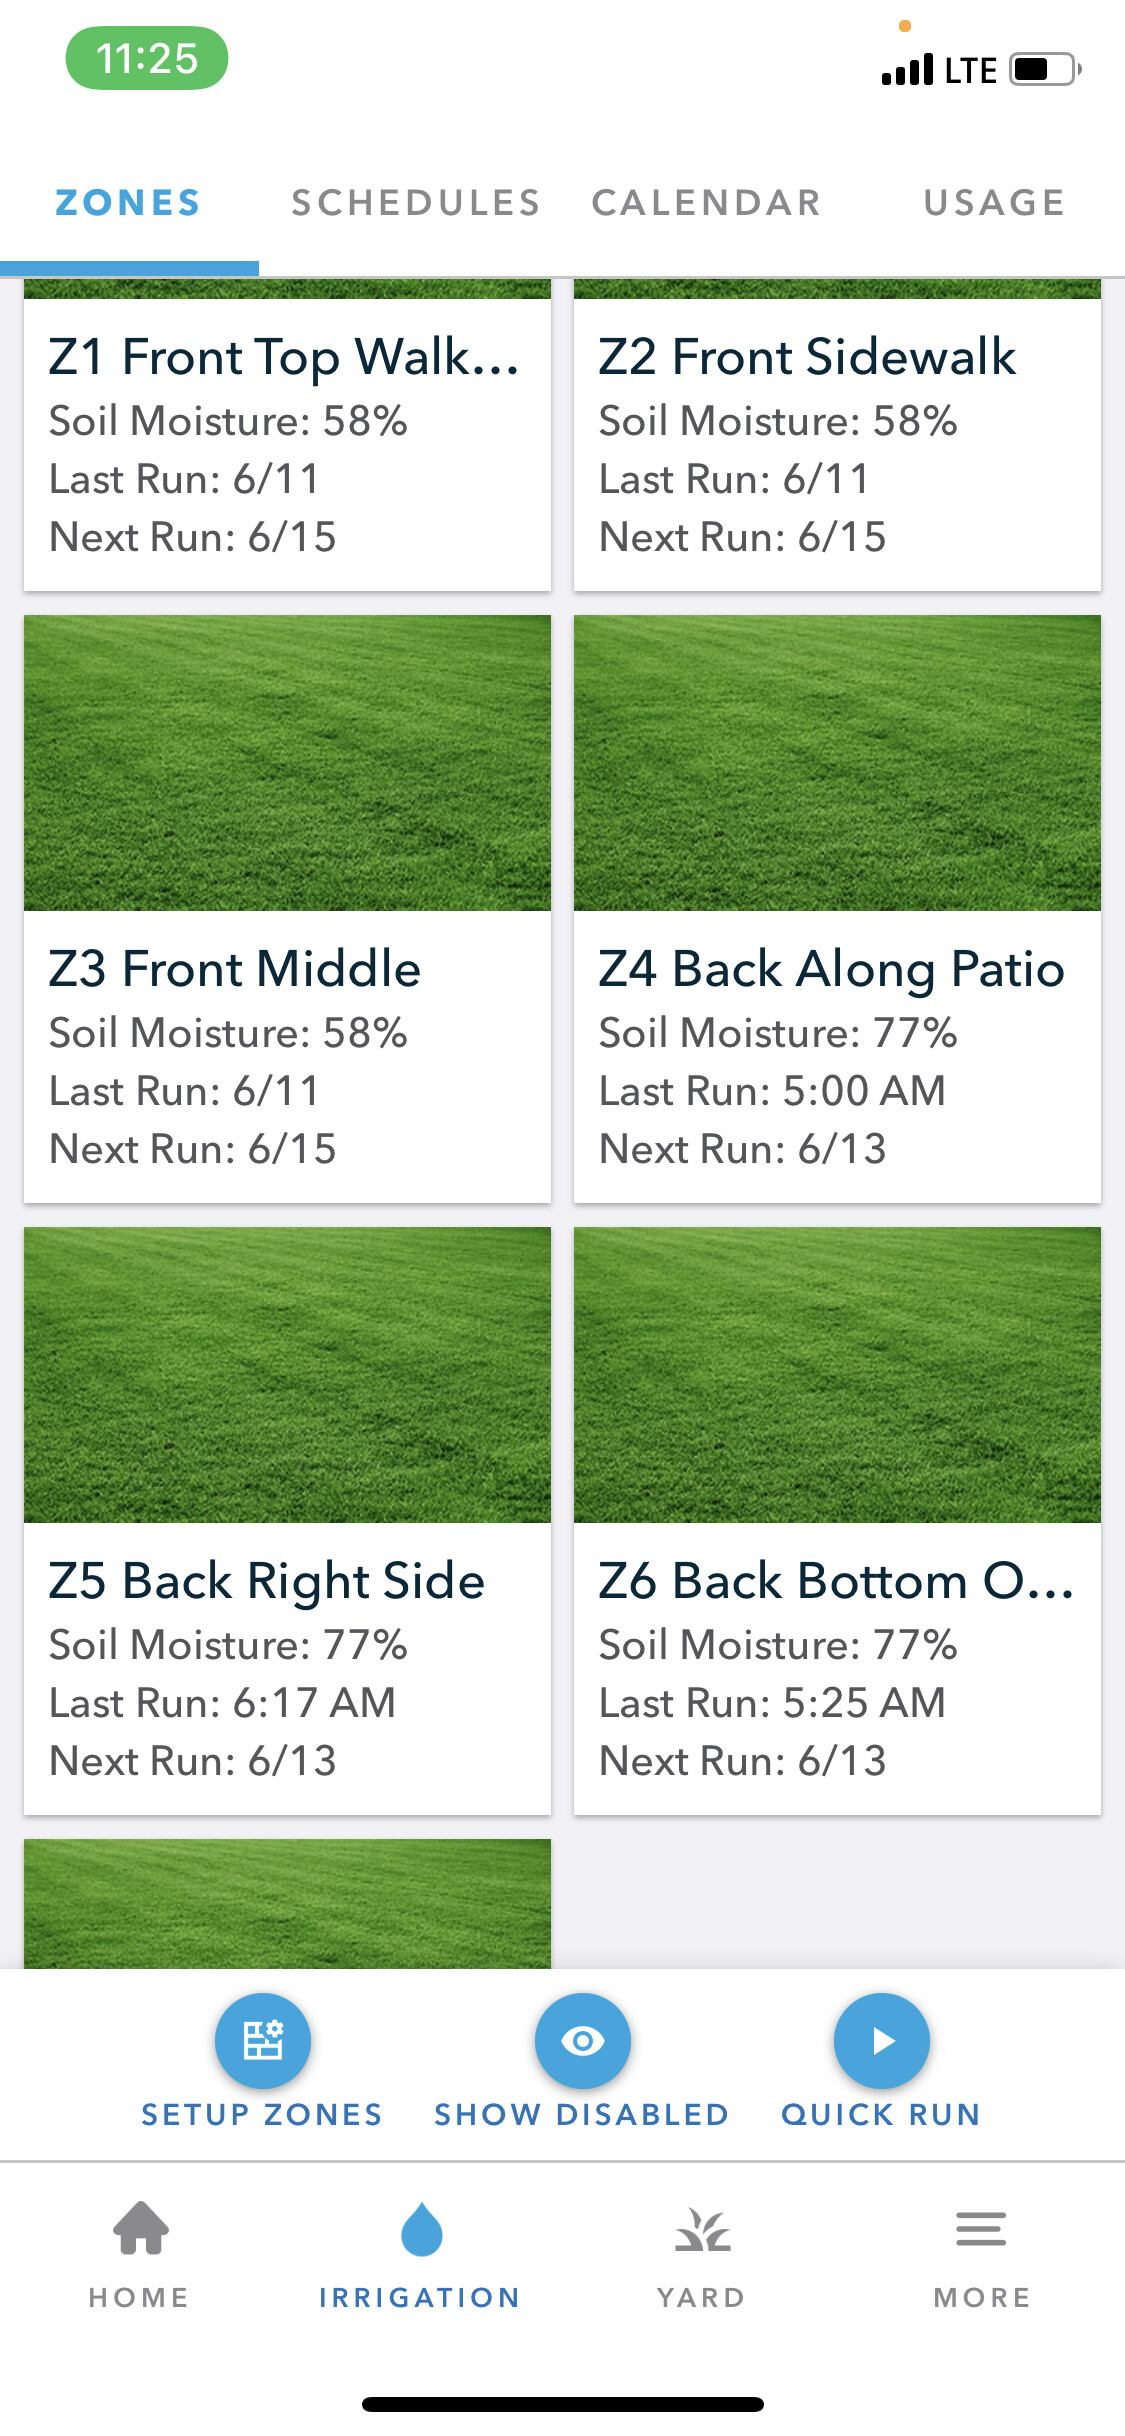
This isn’t making sense to me. Today zones 4-7 irrigated (back yard some shaded to shade) at 5 am, yesterday z 1-3 irrigated (front full sun).
Currently the moisture levels in the front are lower than the back, as should be because the back was just irrigated this morning. Our weather yesterday was overcast and rain, today is overcast 67 degrees.
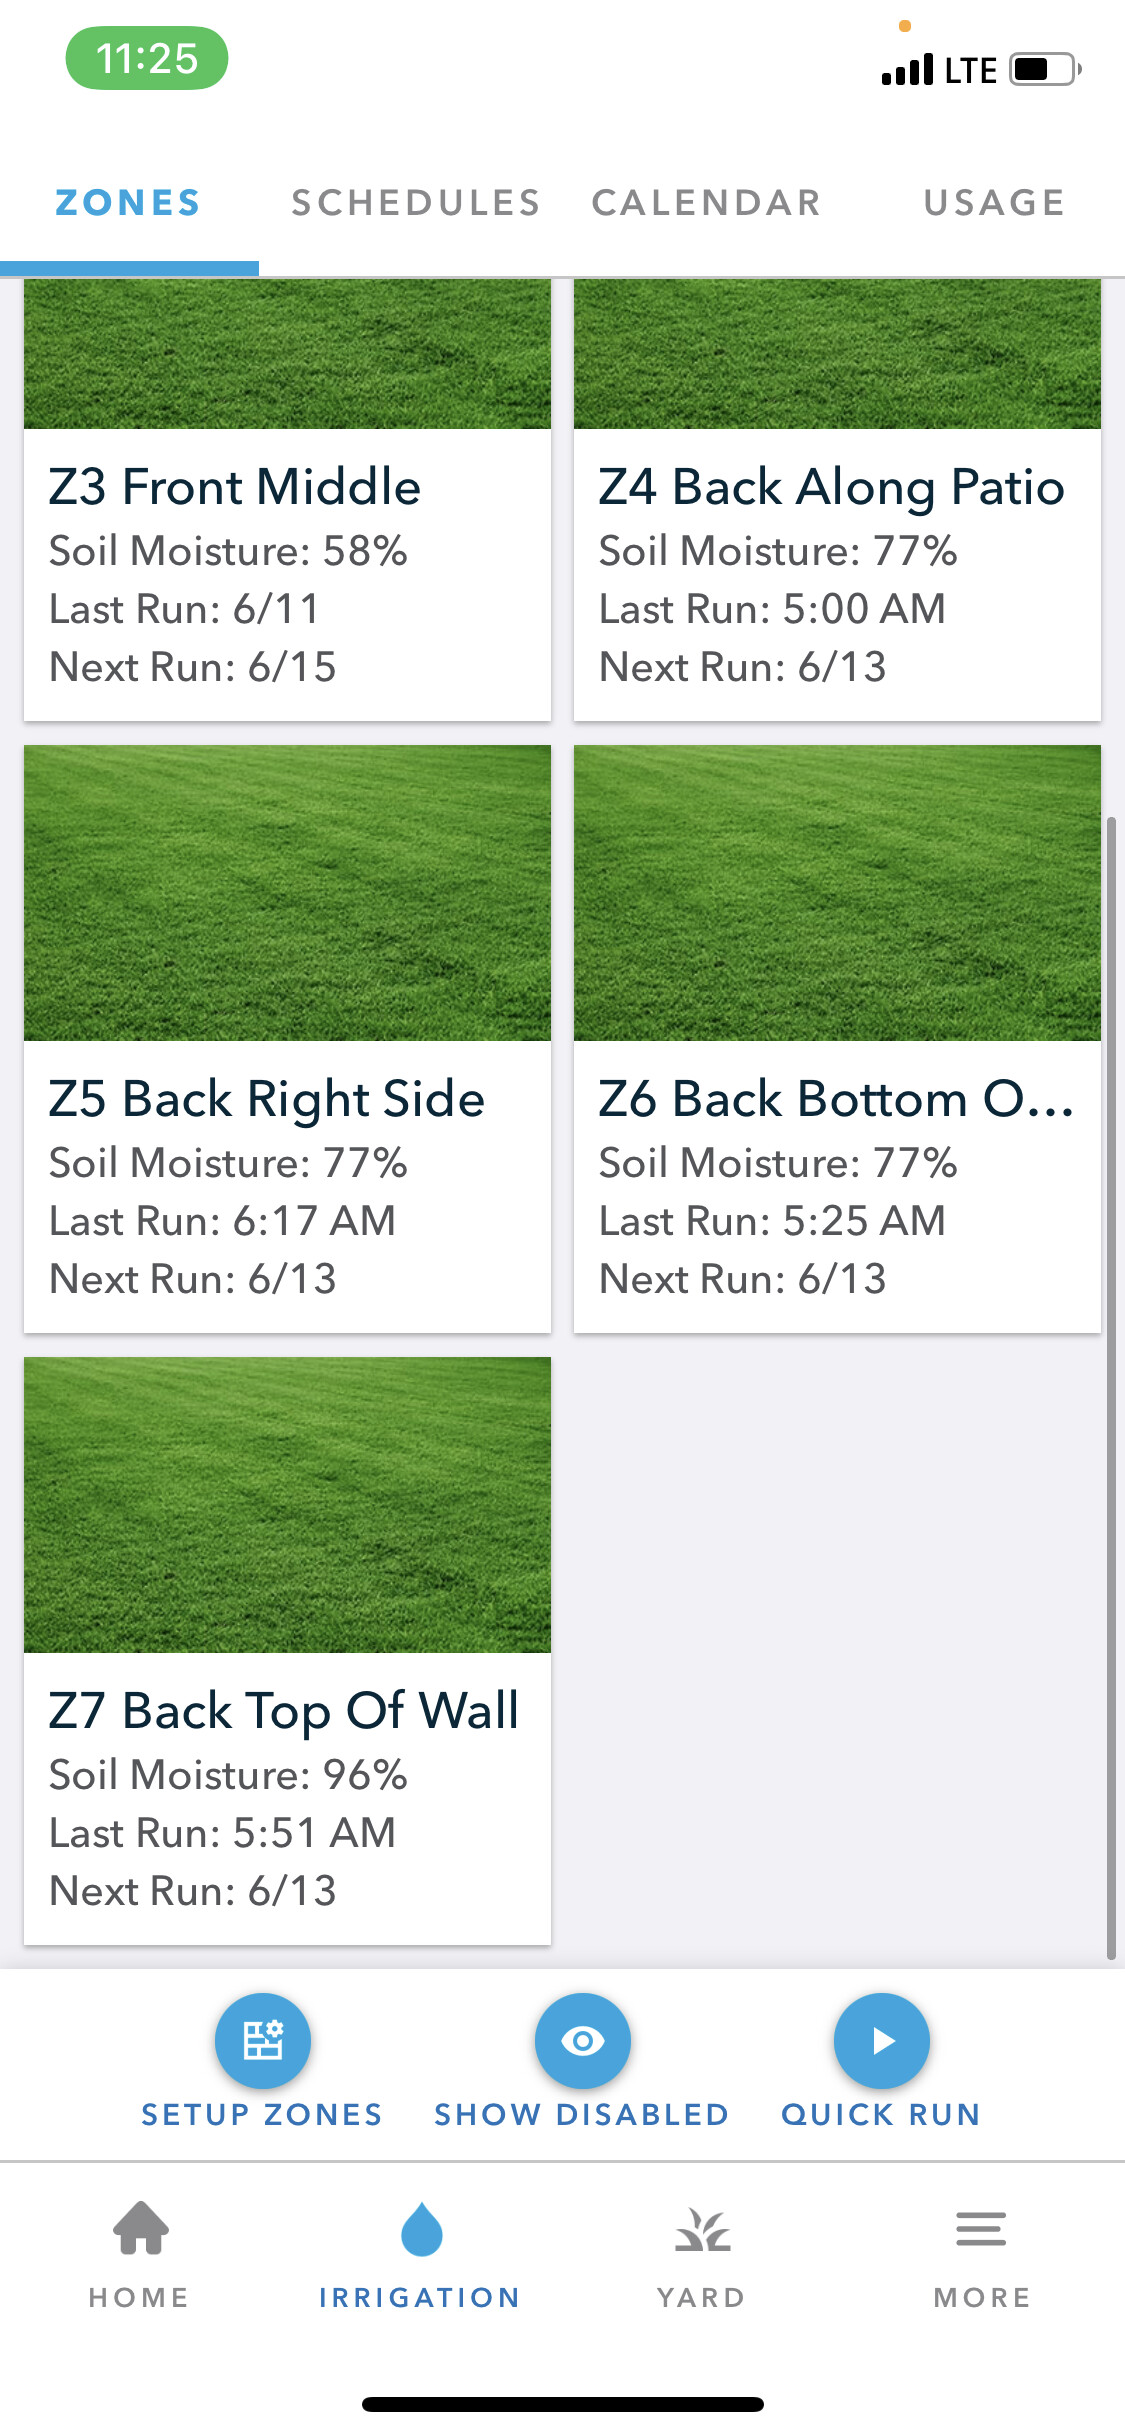
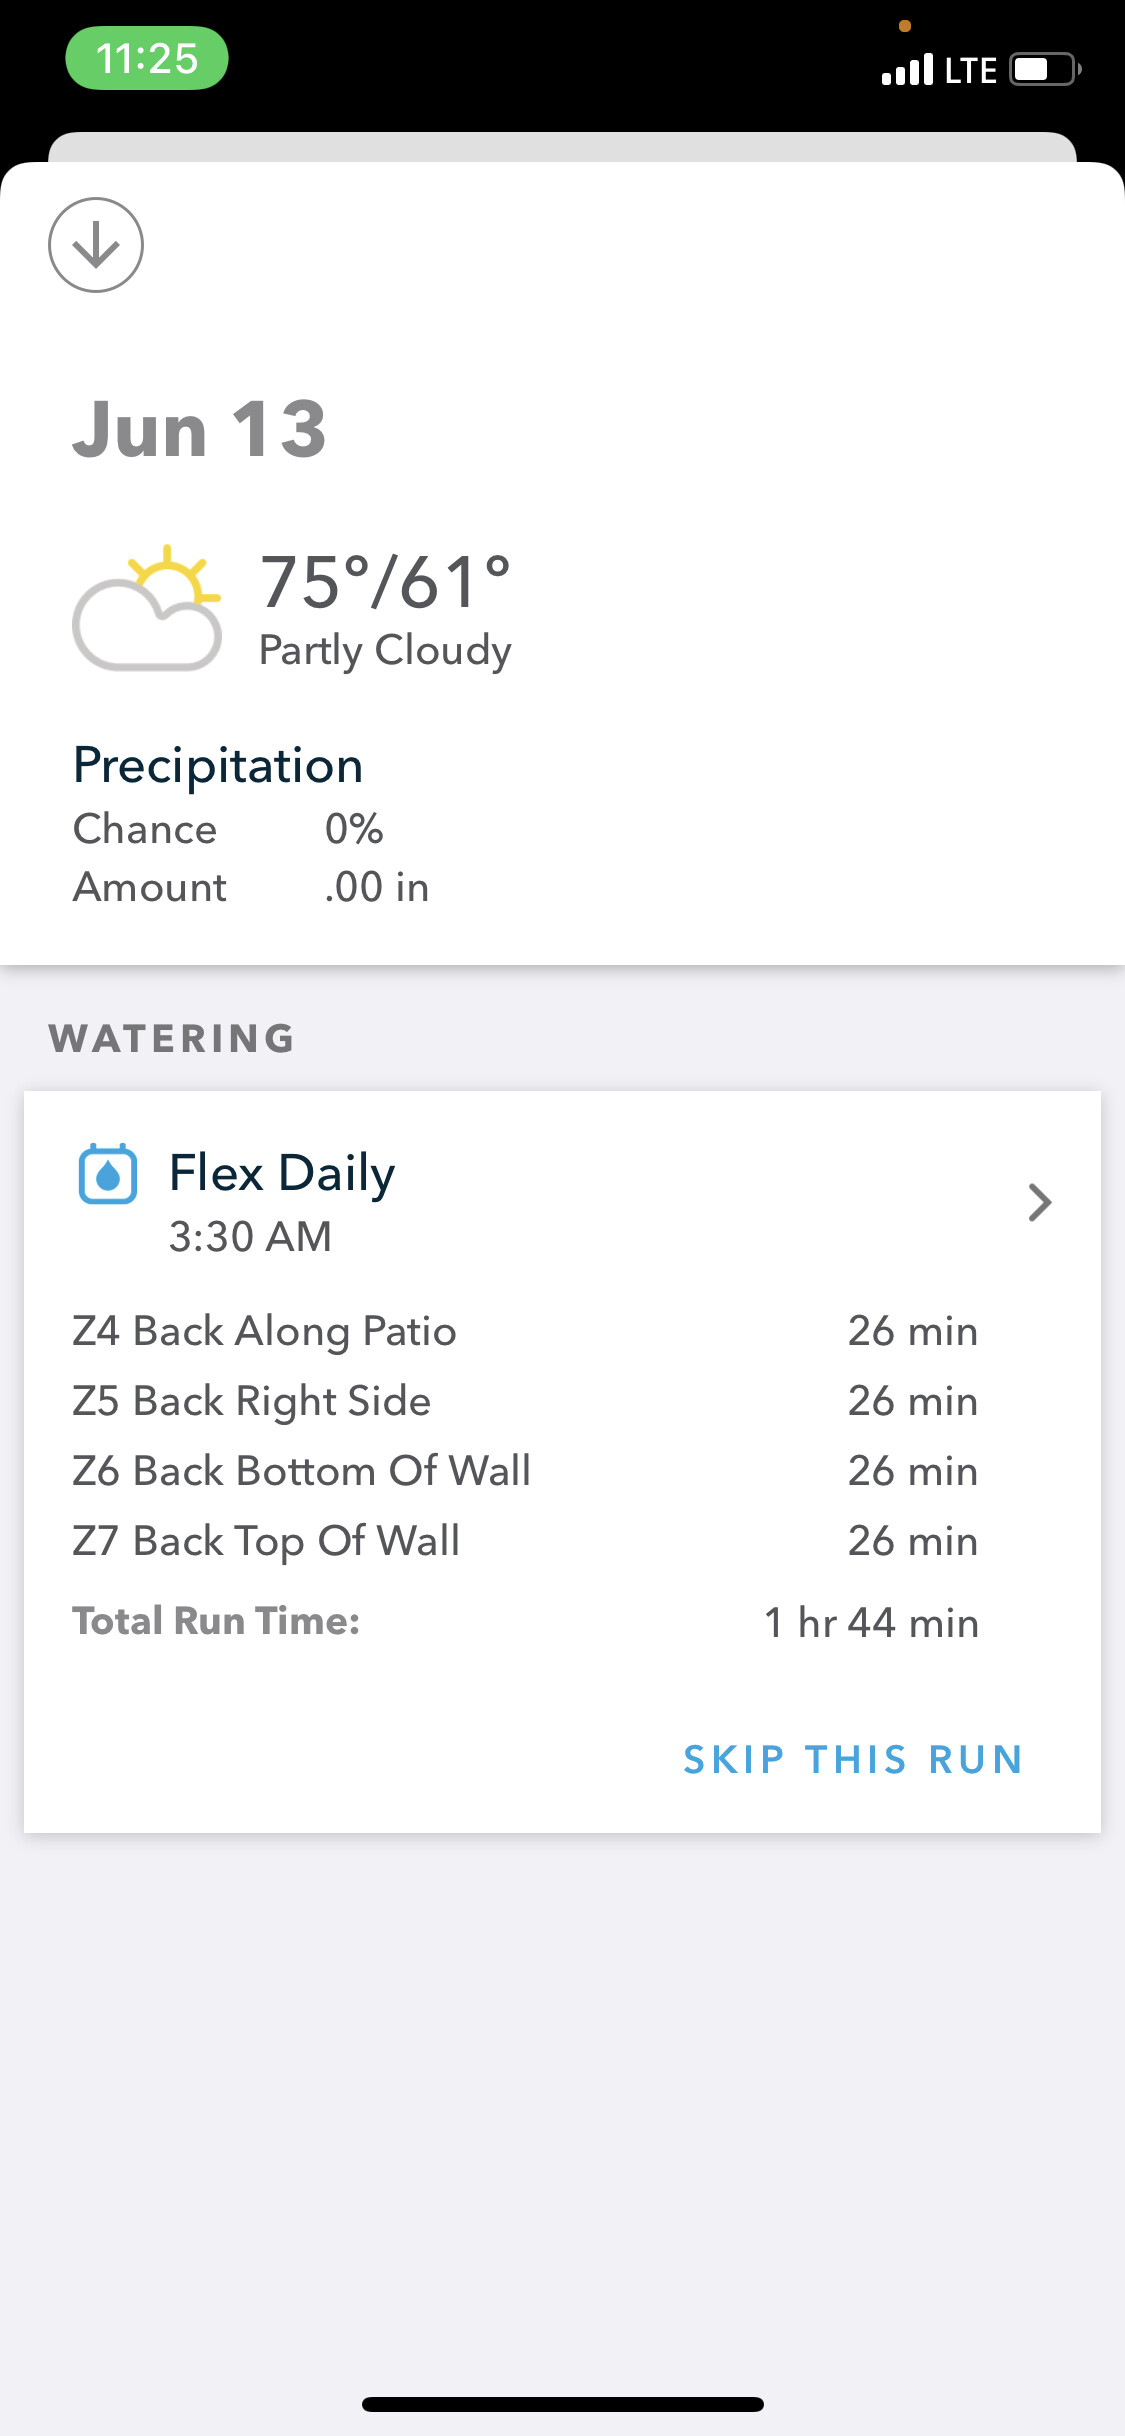
On the calendar view it’s showing that zones 4-7 are going to irrigate again tomorrow, two days back to back? Z7 my mostly shaded area, which is 96% soil moist is going to irrigate again.
Why would the back zones irrigate back to back like this, compared to the front which is less soil moisture at the moment and gets a ton more sun?
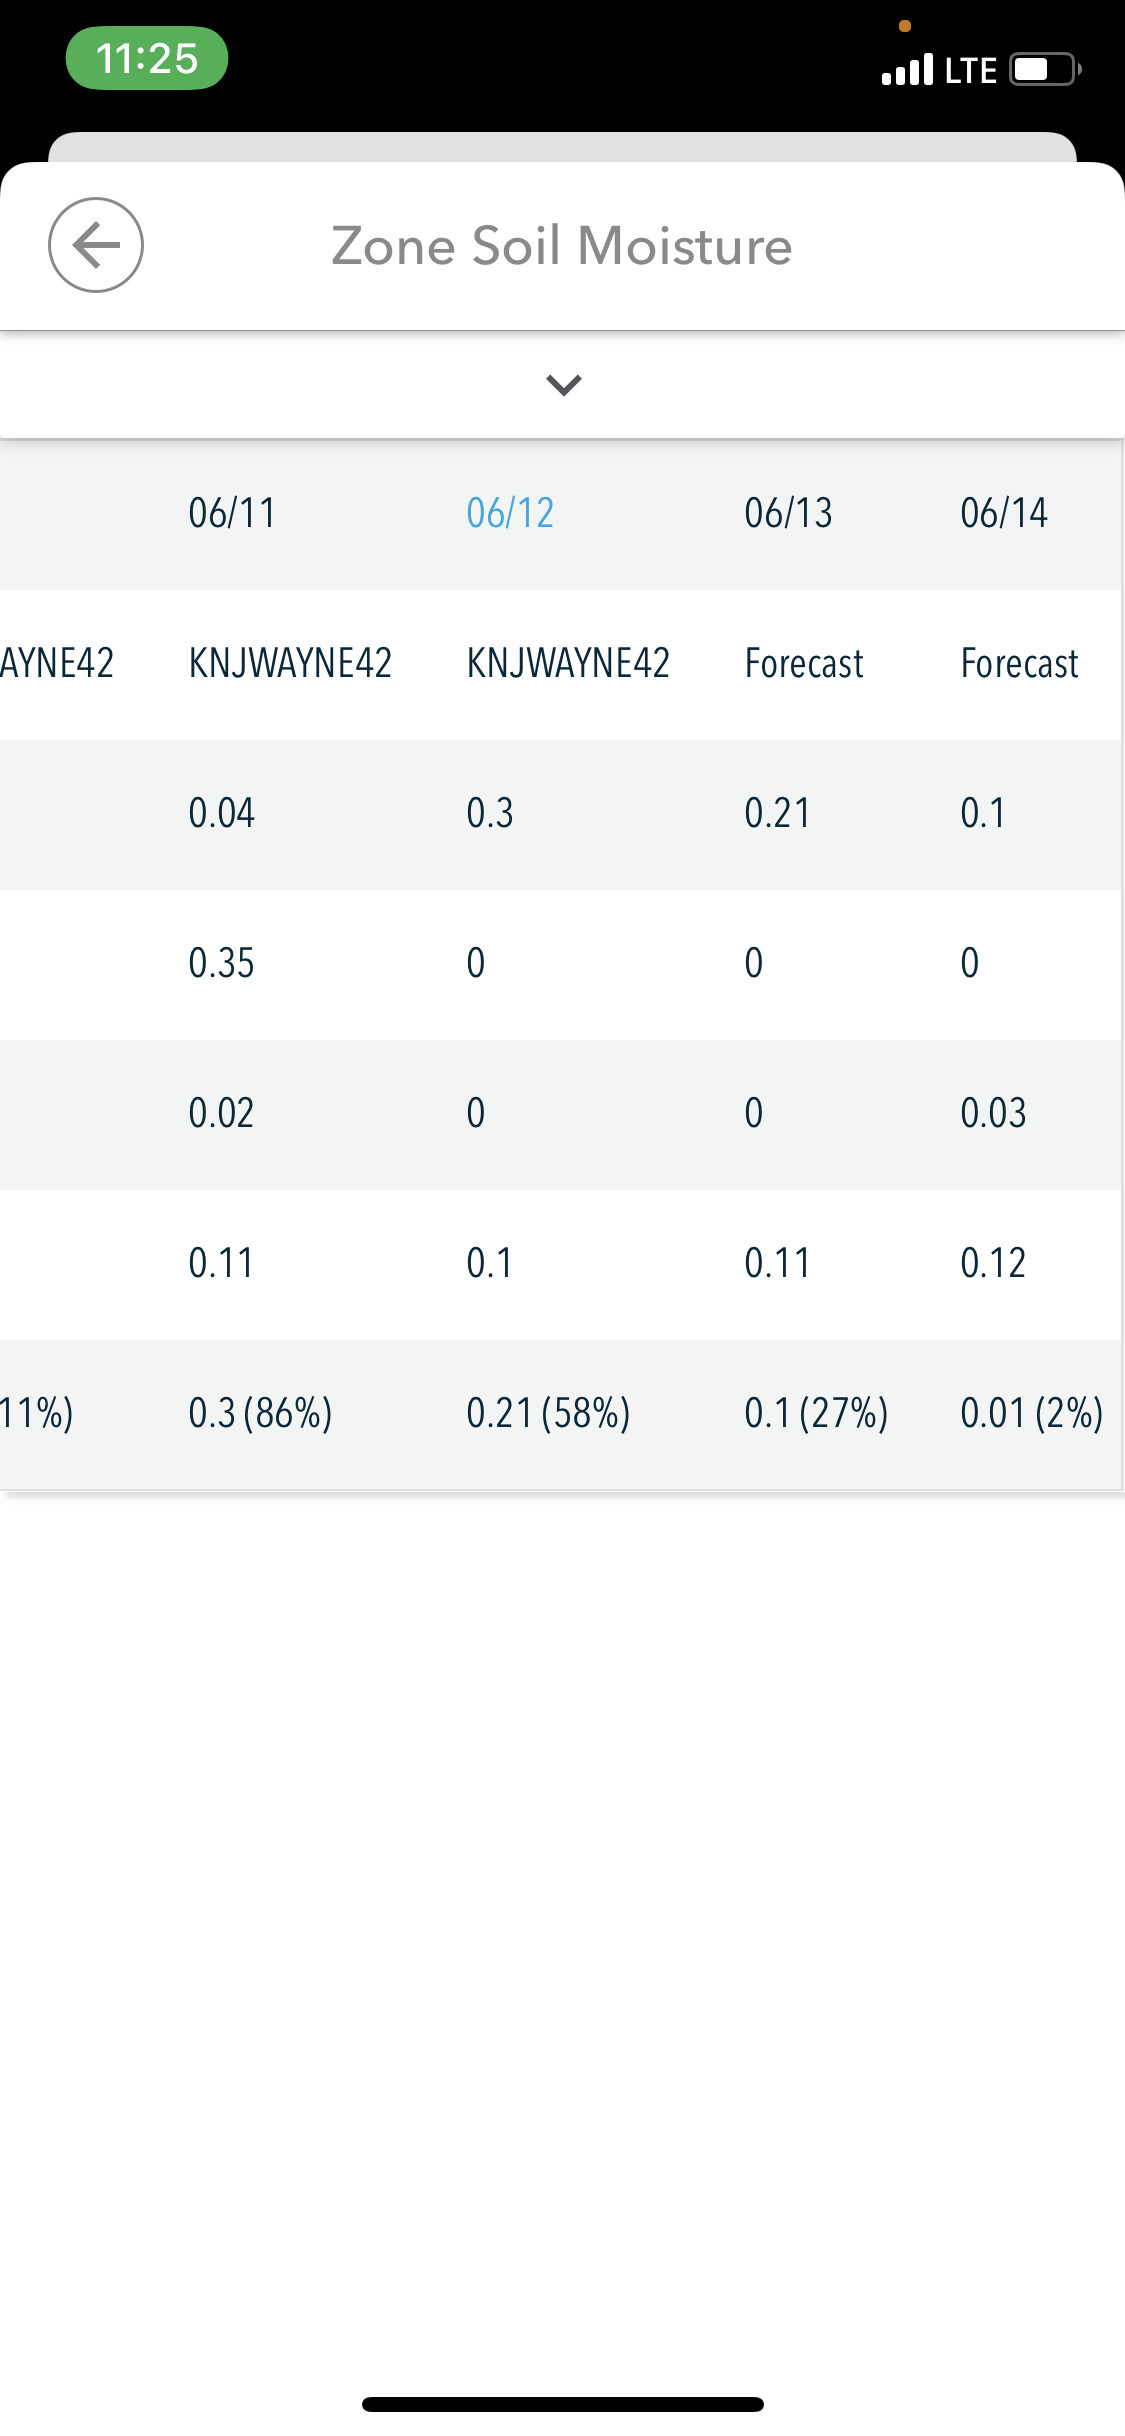
While the zone does say it will water tomorrow, the Z7 chart indicates it won’t water until at least 6/15, 3 days from now, and that seems about right.
I think I have seen the same thing, where the zone says when an upcoming watering will occur, but the chart, graph and actual operation differ. Perhaps someone else knows why they might be different?
I no longer trust the the overview of zones for seeing the days that a zone is going to water. I used to think that doing a refresh of that view would fix it, but not so. Just checked mine using the web interface (refreshed it first), and by the 3rd zone, it already isn’t right. The overview says it’s going to water on the 15th, but the moisture details says it’s going to water on the 14th. And based on observations, I trust the moisture details.
It has now updated, and all zones will water again on the Tuesday the 15th. I guess everything looks like it’s running as it should, just got to have confidence now and let it do it’s thing.
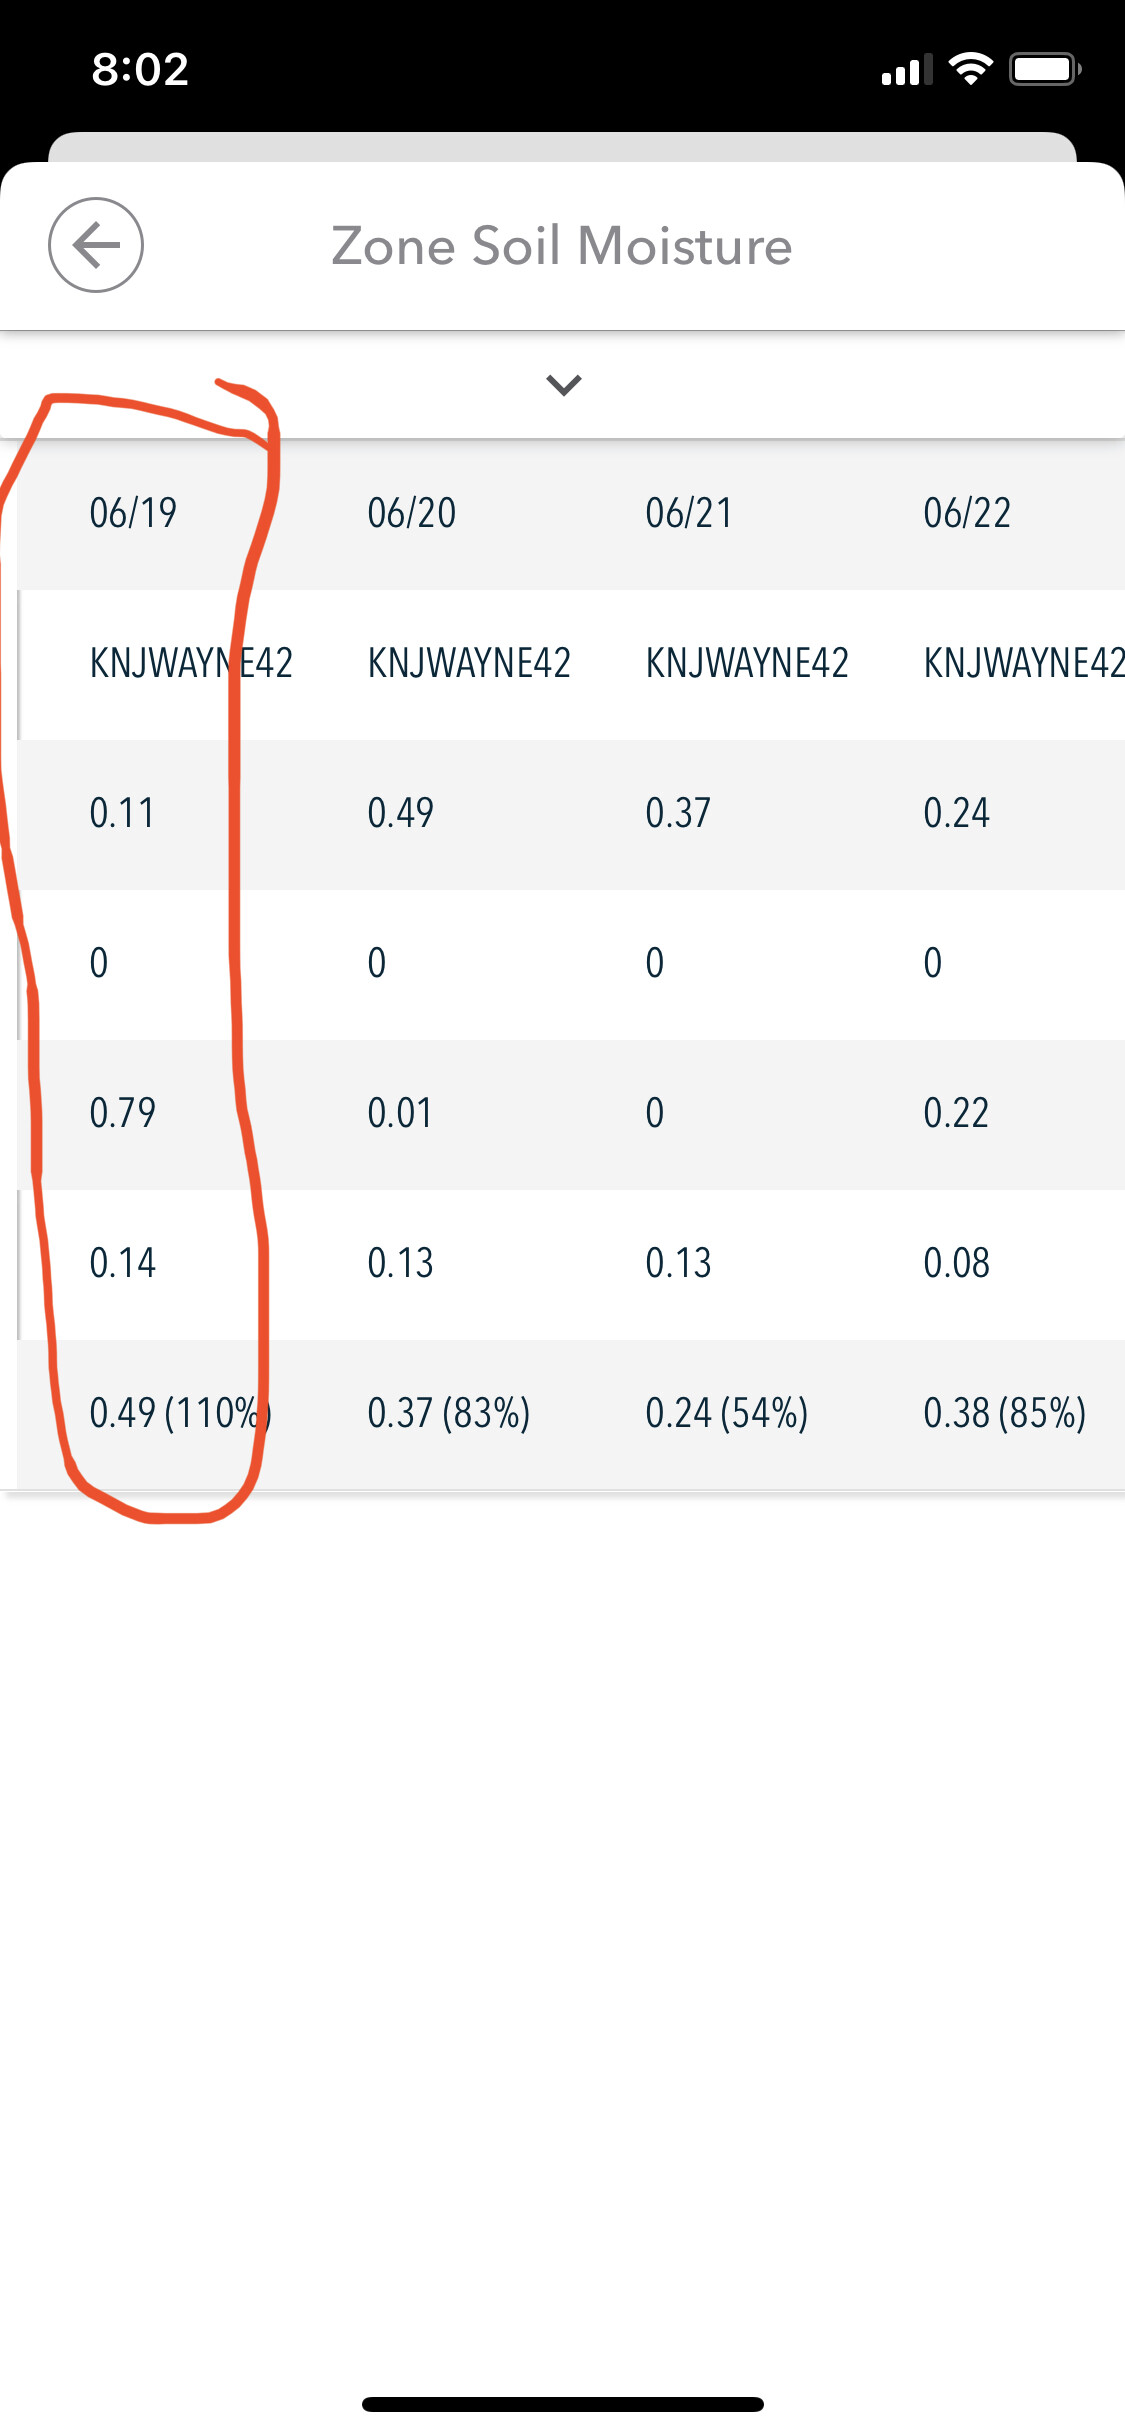
They don’t add up because of excessive rain. Rain over and above resulting in a moisture value of 110% is not considered. That is, the maximum moisture can be 110%, which results in your case to 0.49" of water. Anything over that will not change it, as the rain is assumed to just run off.
So it appears when I use local weather stations in my area, the rain precipitation is under reported compared to the local weather network. I know it was recommended to use the local weather station, but curious on why weather network wouldn’t be better? Doesn’t this use more data points (locations) to better average? Wouldn’t it gather from the local weather stations anyway?
That’s the problem, it will use an average. Unless you have an average amount of rain, it won’t be right. I’m sure you’ve seen weather forecasts where rainfall for a day varies by a factor of 2 or 3 between areas only 5 miles or so apart. You want a station that gets as close to the amount of rainfall your location gets, normally the closest one.
So when I did a catch cup test it said I was putting down .21 in/hr so I would need to water a ton!!. They are 1.5 gpm nozzles. My well only produces 6 gpm which is why my nozzles have to match.
@rraisley - I know this post is several years old but wanted to say thank you for your detailed thoughts on proper watering setup. I have spent so much time calibrating, configuring, doing catch cup tests (so many times over the years), root measuring, mason jar testing, changing my monthly crop coefficient numbers, etc…. and my lawn still turns brownish in the summer. I have tall fescue and I know the Southern California summers are brutal but I was so focused on everything being accurate and assumed the system would water correctly.
I have always had a hard time justifying changing one of my controller’s variables to make my system water longer when I knew they were all setup correctly. I know how much water my zones put down. I know my soil type. I know my root depth. I know my lawn type, etc….
Your recommendation of changing the crop coefficient is genius. It made me rethink things. I have always assumed the 12 month crop coefficient recommendations that are on the internet were accurate. I guess they are more a guideline and they could be wrong. So I took your recommendation and bumped up the recommended number for September by 10%. Time will tell and it might be too late for this summer but thanks for pushing me outside of the box.
After years of struggling I’m done. It seems in the North Phoenix area, there’s nothing I can do to get my soil type correct and get the flex daily to water correctly. I now have it set to manually water every 3 days during the summer using locally recommended amount of inches per week. I’ve tried at least four different sources to figure out the soil type and they can’t seem to agree. I put my soil in jars and that was even fairly inconclusive. It’s very frustrating. This particular variable is perhaps the most important but it’s just a big stupid guess in reality.
I don’t think soil type is as important as you/they think. All it really determines is how much water your root depth of soil will hold at one time (Available Water). If it’s set too high, water will run off and not benefit the lawn. You should be able to notice that in puddling and runoff. If it’s set too low, it will require watering more often, resulting in more shallow roots but but it shouldn’t affect the grass that much. Reducing or increasing Available Water is exactly the same as increasing or decreasing Allowed Depletion. Together they all just determine how how your lawn is watered.
If you want/need MORE water to be applied to your lawn (i.e. it starts to wilt in hot weather), then none of those factors will help. Increase the Crop Coefficient to make the program apply more water over time. And be sure you have an accurate value for Nozzle Inches per Hour, either by measuring with catch cups or actual water usage over actual zone area. That is critical IMHO, and something many people don’t bother with. And shouldn’t have to, but it is what it is.
I’m in AZ as well, and while my grass and vegetation looks solid (considering), the summers here are brutal and there is borderline no amount of water you can put down to keep things lush when we have 100+ days of 100+ temps. I heard on the radio yesterday that the average temp this summer was 99 degrees. I have some bushes that just cannot handle the heat and are struggling big time, but they will come back. I have tops of citrus and Ficus trees that are physically burnt. No amount of water will keep that from happening.
But, all in all, my yard looks better than all my neighbors yards…
If I remember correctly, it was watering too much and too frequently, like I think every two days or something. Every other setting was correct and so I don’t understand why it was doing that. I’m manually putting down about 1.9 in per week and my lawn looks great.
After years of research I think I had settled on manually inputting 0.17 AWC. I think my reply will be unclear if I don’t explain that this was what I used to be doing when trying to get the flex daily working but again, I now just water every 3 days putting down about .75 in each time.
For a couple weeks I tried about 1.65 in and I don’t think that was enough. It’s been a crazy hot summer here in Phoenix.