Could someone please enlighten me as to how the weather data you collect from whatever source is utilized to provide the ETo data. This data, if inaccurate, can have disastrous effects on the landscape when Using flex scheduling.
I am currently running a comparative test of multiple zones with exactly the same settings as another manufacture that i have been using several years now. The results have been that the weather data from that of multiple sources for the Iro have been consistently incorrect. My gage to this is quite unscientific but works, Green Grass with a hint of stress with competitor vs Brown Grass Iro. I have had the competitors controller installed for several seasons and I know my settings are correct because they have not been changed for 3 seasons and the grass remains healthy throughout the season. Once I started comparing the weather data everything became clear. No matter what weather data source I pick, Rachio is always different than what i know works and yes Both units are SWAT certified.
I have been able to manipulate particular settings of the zones in order to achieve a correct amount of duration and frequency that is needed not to have brown grass. Basically i created a workaround that worked with the constantly incorrect ETo.
Something Similar to what you are talking about in another post “Even simpler than that, adding a frequency slider that will not make you understand MAD, root zone depth, field capacity, etc. Under the covers, I’m thinking we will just apply an offset to the crop coefficient, so you are effectively tracking towards more/less ET. That will magically make you water more/less frequent without having to change other values” How is Duration accounted for?
I reduced the allowable depletion from 50% to somewhere in the 30% range and did the same with the Efficiency slide as well. This kept my runtimes similar but increased the frequency. Instead of 4 to 5 days between watering I started seeing 2 to 3. There seem to be a lot of ETo’s in the .10 to .12 range on days it is 90 and the wind is blowing. Other controller is utilizing ETo numbers like .18-.22 which i feel is much closer to reality.
Take this week for instance, I am curious as to what your average ETo is across the Denver area and how does that compare to the numbers I am seeing in the moisture chart. My guess is it should be well above .11 ETo avg I am getting.
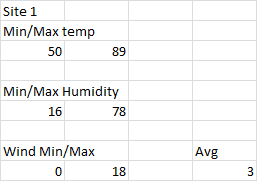
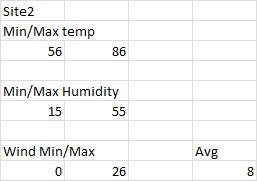
If you can get me the temperature data (max/min temp, humidity, wind) and the ET value the other product is seeing, I can calculate on our side and see what we come up with.
I brought this up in another thread too. The Iro ET values just seem low. My town has five weather stations that calculate ET. They are consistently higher on the ET side versus what the Iro calculates. The pws I am using appears to have VERY good weather data that pretty much mirrors the towns observations. However the ET values vary widely.
Yes, but I question even .75 as the Kc for High quality turf at this time of year for my location. The last week collected avg for Northern Colorado was .90 for high quality turf. Because Kc directly affects the daily ETc within flex scheduling and ETc in turn directly affects the number of days between watering events, I think it is real important to allow for correction, the question is how? and can you pull local current Kc into your equations? Right now, I can come up multiple ways to produce the outcome I need, and your are now mentioning adding another way to modify which is getting further from you intended direction “simplicity”.
If you do add a way to change Kc, all that needs to be displayed visibly would be starting point and the number at which you choose. (Existing value is .75 new value I choose .90) I think it is important to remember we are only assuming we are getting correct good weather data to base all this off of.
Still not sure if this is the right solution though. One more item in advanced setting to screw up.
Thanks for this. Need little more data. I need the station names and weather dates so I can compare our retrieved weather data and generated ET values to what you are seeing.
Agreed on 75% being too low. Raising to 83% this week using EPA guidelines. We started this back in June and we were trying to be very conservative. Trying to get feedback on what needs modifications and what we need to make easier to adjust.
For next watering season we won’t have you adjusting any of these variables if you don’t care to. It will just be a frequency dial. Will try to also expose the ability to modify crop coefficient. Think that is the only parameter that can not currently be adjusted.
I take it the frequency dial will use the current ETc average and still adjust frequency as weather changes? And ETc will still drive the actual frequency over time. Your dial would be used in the same way max depletion is used now, it just won’t affect duration of the run time?.
Yes, I was thinking something that is relative to how we subtract from the soil moisture balance.
So, if we adjust (offset) the amount of ET we use (crop coefficient), this should be a good way to modify the frequency. The zone will either be subtracting more/less ET daily based on the frequency adjustment applied. This will be abstracted out so it just looks like frequency +/-. Incremental changes, wont be raw values.
So could you leave everything as it is and just add a descriptive box that identifies frequency (everyday, every 2 day, etc.) along with percentage of allowable depletion that you already show on the slide at X Percent. (50% every 3 days, 35% every 2 days, 25% every 1 day). The user can still use the more or less but under the zone schedule to adjust the duration if necessary. Along with having the correct Crop Coefficient you already have everything you need to make adjustment.
Correct because ETo changes, sometimes 50% could mean every 4 or 5 days at the right time of year,other times it might mean every 2 days. When you make the adjustment you are adjusting to the current ETo calculations

 , and it all starts with the data.