Trying to understand the way Allowed Depletion works.
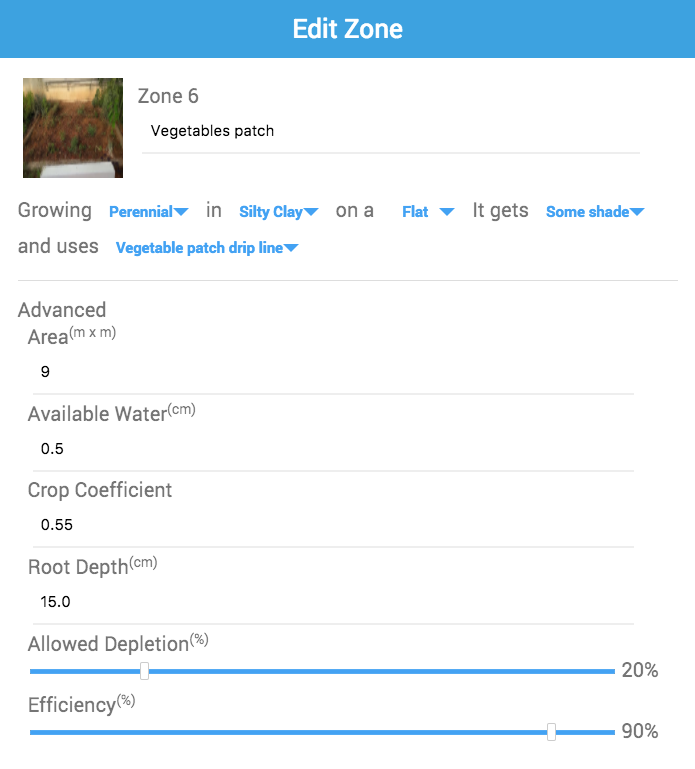
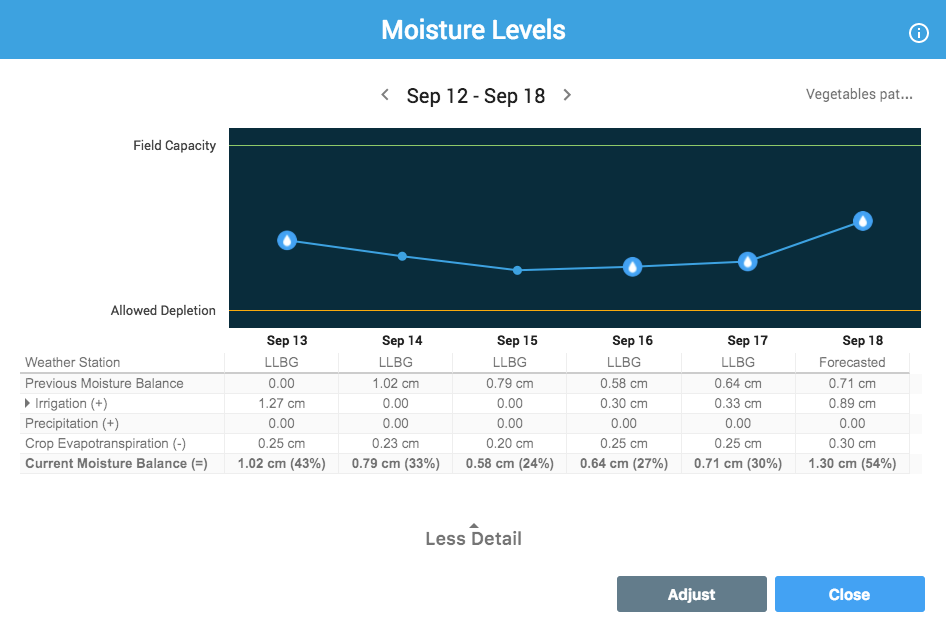
I have a zone setup with custom nozzles (based on measured flow rate and area) and the right settings for the area. I set Allowed Depletion to 20% and got the following info for Moisture levels:
If I look at the data for Sep 18, I had (with 20% depletion) 0.66cm moisture balance, which is just above 100%. After changing to 80%, I now have moisture level at 1.3cm (double!) which is only 54%.
I understand that the entire calculation is based on the depletion point (the minimum amount becomes the new zero), but I can’t understand why field capacity (100%) changes? and why I suddenly have more water…
The short answer is that the field capacity is the difference in moisture level between total saturation and the allowed depletion percentage. So increasing the allowed depletion means more moisture can be lost before watering is required.
I notice that changing the units from US to metric also changes the Available Water value for the zone. I am guessing that the number shown in metric units is the available water in CM per inch of root depth. It would have been simpler if Rachio made the AW a percentage - the amount of water that each unit of root depth can hold. In US units, multiplying the AW x Root Depth gives the total water available for the root zone, given the soil type. Multiply that number by the allowed depletion to get Field capacity.
Looks like you need to divide the AW by 2.5 to get the amount of available water per cm of root zone. So if you use .2 for AW instead of 0.5, your calculation is AW (0.2) x RD (15 cm) x AD (0.2) = 0.6 cm in the first case. If you use 80% allowed depletion, you can lose 4 times the water (2.4 cm) before watering is needed.
I would prefer if the moisture level graph tracked the absolute moisture level - where 100% is saturated, and 0% is absolutely no moisture. The allowed depletion level can be a dotted line to show when watering is needed. Changing the allowed depletion would simply move the dotted line on the graph, not change any numbers. Maybe in V3!
Thanks. This explains it, and is what I thought could be the reason for the strange behavior.
I must say this is a very Non intuitive interface. Lack of units and changing “capacity” is weird. We should have a max capacity line (based on soil etc), an empty (0%) line and a threshold line (allowed depletion based). It would also be nice if the interface presented humidity level on the main screen for each zone - easy to get a glimpse at what we have.