It would be great if I can enter or upload my local water utility rates. This way I can view the cost of water usage and also the savings.
3 Likes
I like this idea. Perhaps Rachio could build this into their software. Fantastic idea. Unless you have a dedicated irrigation meter you will also want to factor in wastewater fees. Rachio could build a software model where you can enter in rates for tiered rate structures, too. If you don’t irrigate during the winter, then that is your baseline water use for indoor water usage.
2 Likes
Yes, thank you for building on the idea. This should be a relatively simple software update.
2 Likes
I am all in as well. In the meantine I have built my own version based on the utility billings and the rachio water usage reports. I have posted this before and would be willing to share my excel workbook as is.
Here is what the calcs look like:
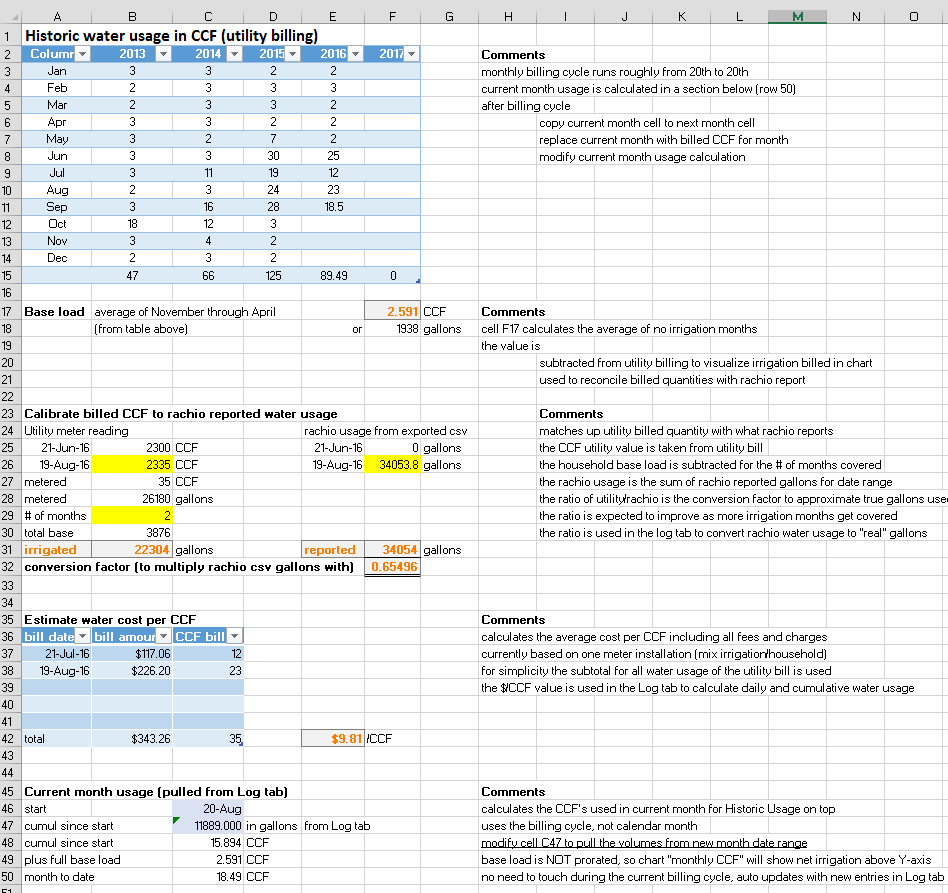
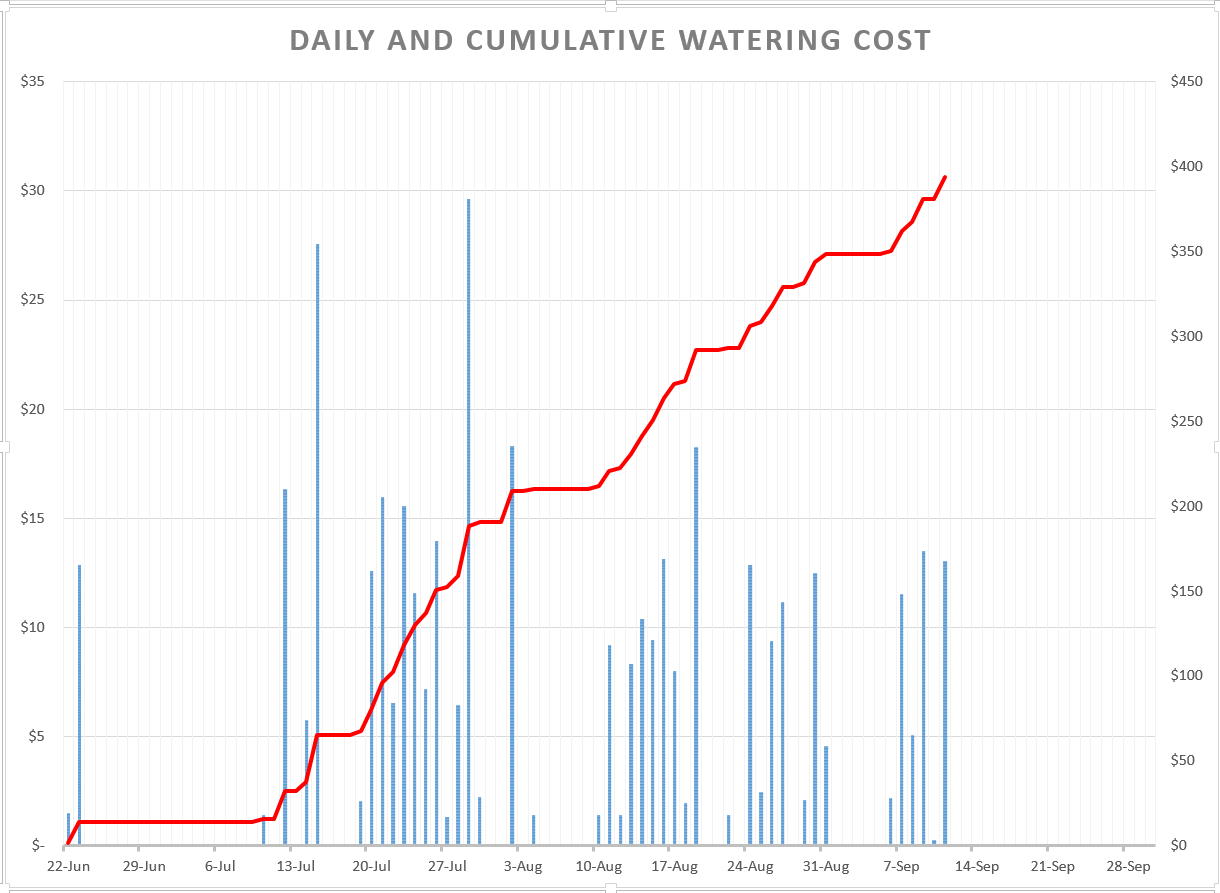
And these are the resulting charts:
This one uses the calibrated gallons and, as @robertokc mentioned, the cost net of the regular household load, and including the wastewater charges per the calculations above. It’s my monitoring for the day to day pattern.
And this one is my year over year chart, using the household baseload as the Y-Axis intersect, so you can see what is irrigation on top of household. For fun my calcs above give you the month to date (in this case September).
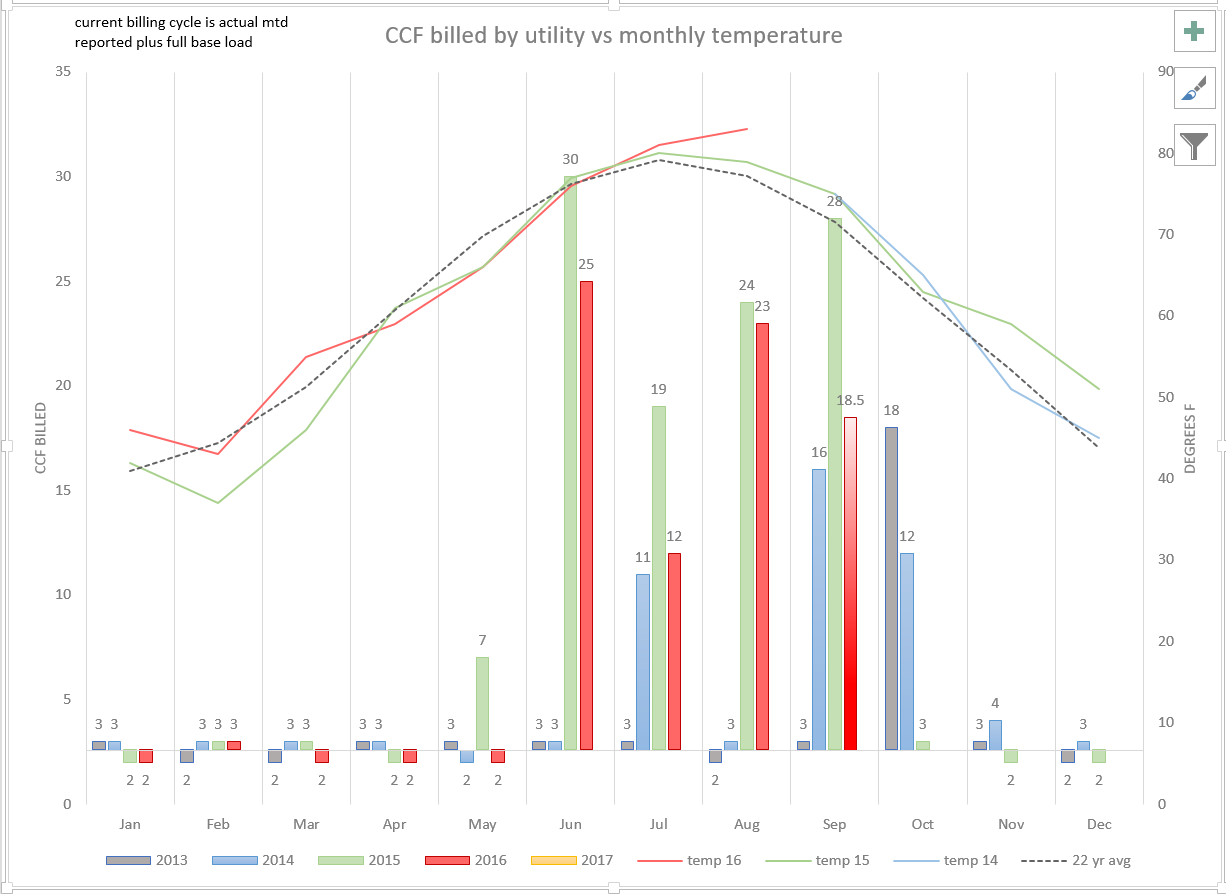
So far, I strongly believe that rachio has saved me quite some money, and my yard looks a lot better than in previous years, because the water is applied at much better times.
Having said that, and you can see this from the temperature profile, we deal with a lot more heat this year and I do have heat stress on my fescue in the front, but most neighbors lost it to bare areas and weeds. As @Linn knows, it is very hot and dry since July in North Carolina.
@franz, you mentioned in an earlier post that the reporting out package for the next version will be much more extensive. Will it give us the abilities to visualize our results in a way we are discussing here? Seeing is believing and it’s motivating to watch progress. That’s why I have started to compare temperature profiles to normalize the results.
5 Likes
What you have done is amazing and way more than I visualized. Love the graphs. It really helps to motivate both water conservation and pocketbook savings.